Analyze Tab
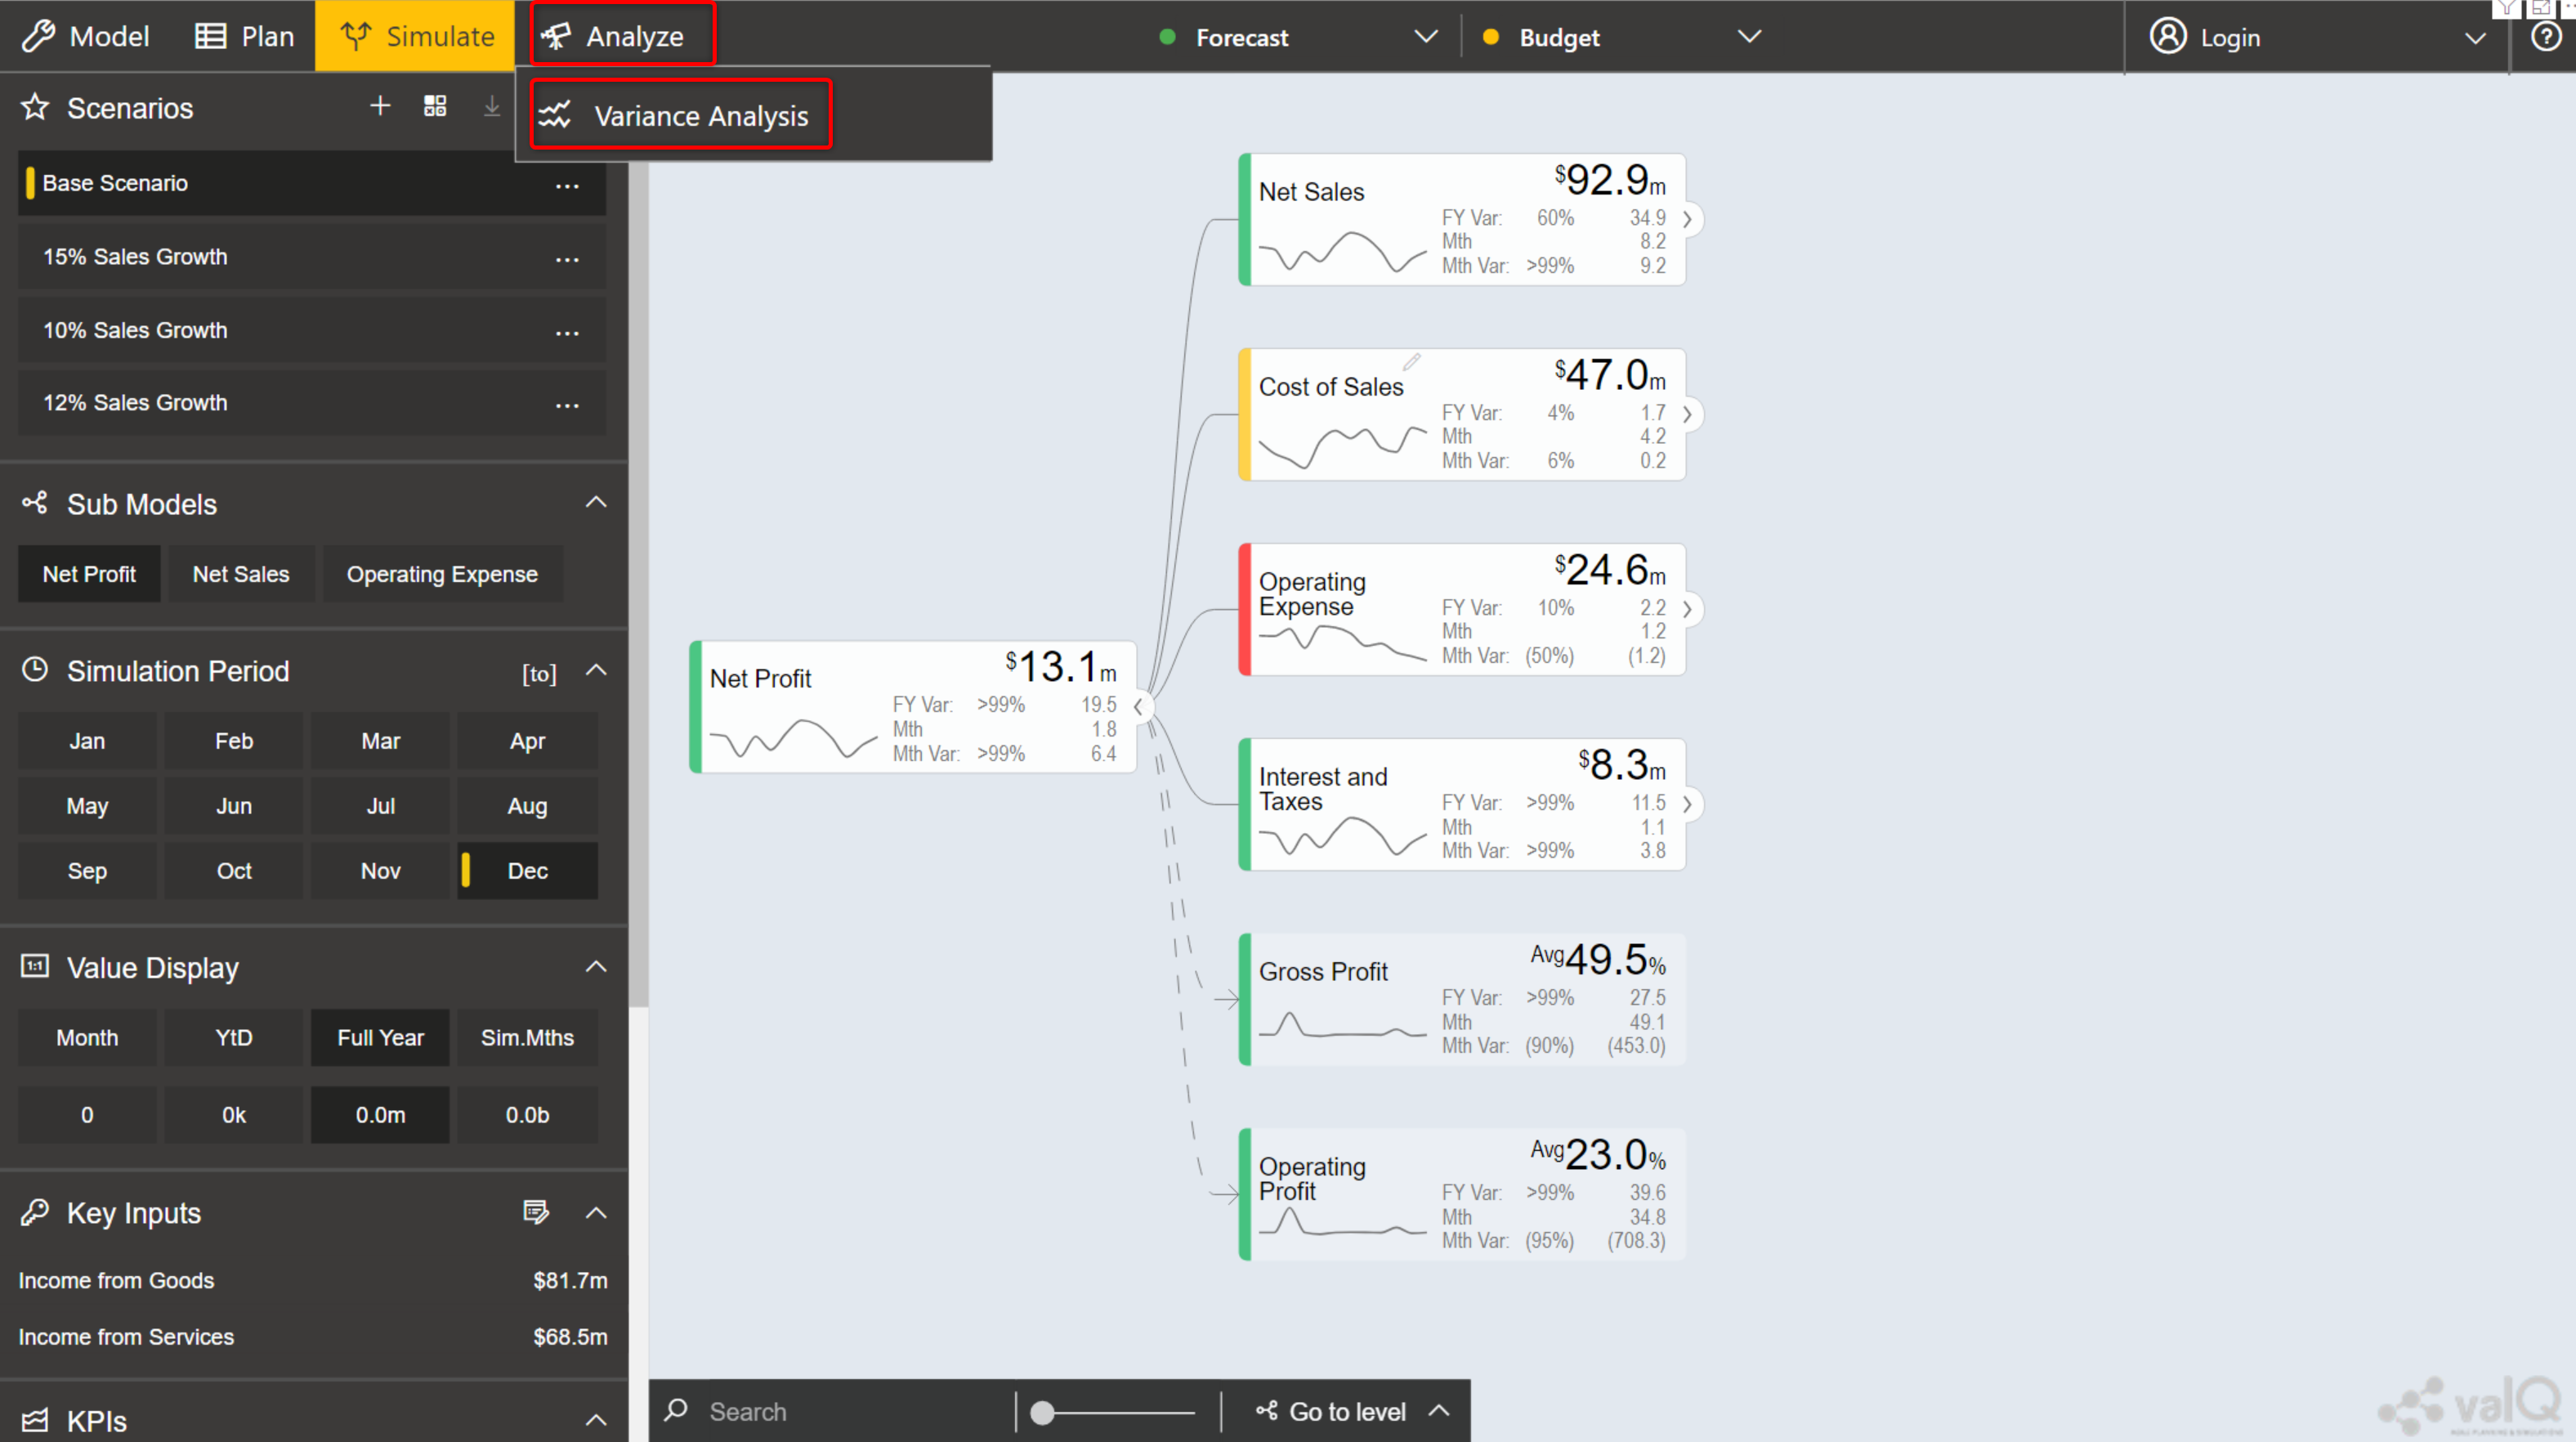
The Analyze Tab allows the user to run advanced analyses on the data. With 1.4, Variance Analysis has been introduced. Several other features such as Sensitivity Analysis and Time Series Analysis are to be released in the upcoming versions.
Variance Analysis
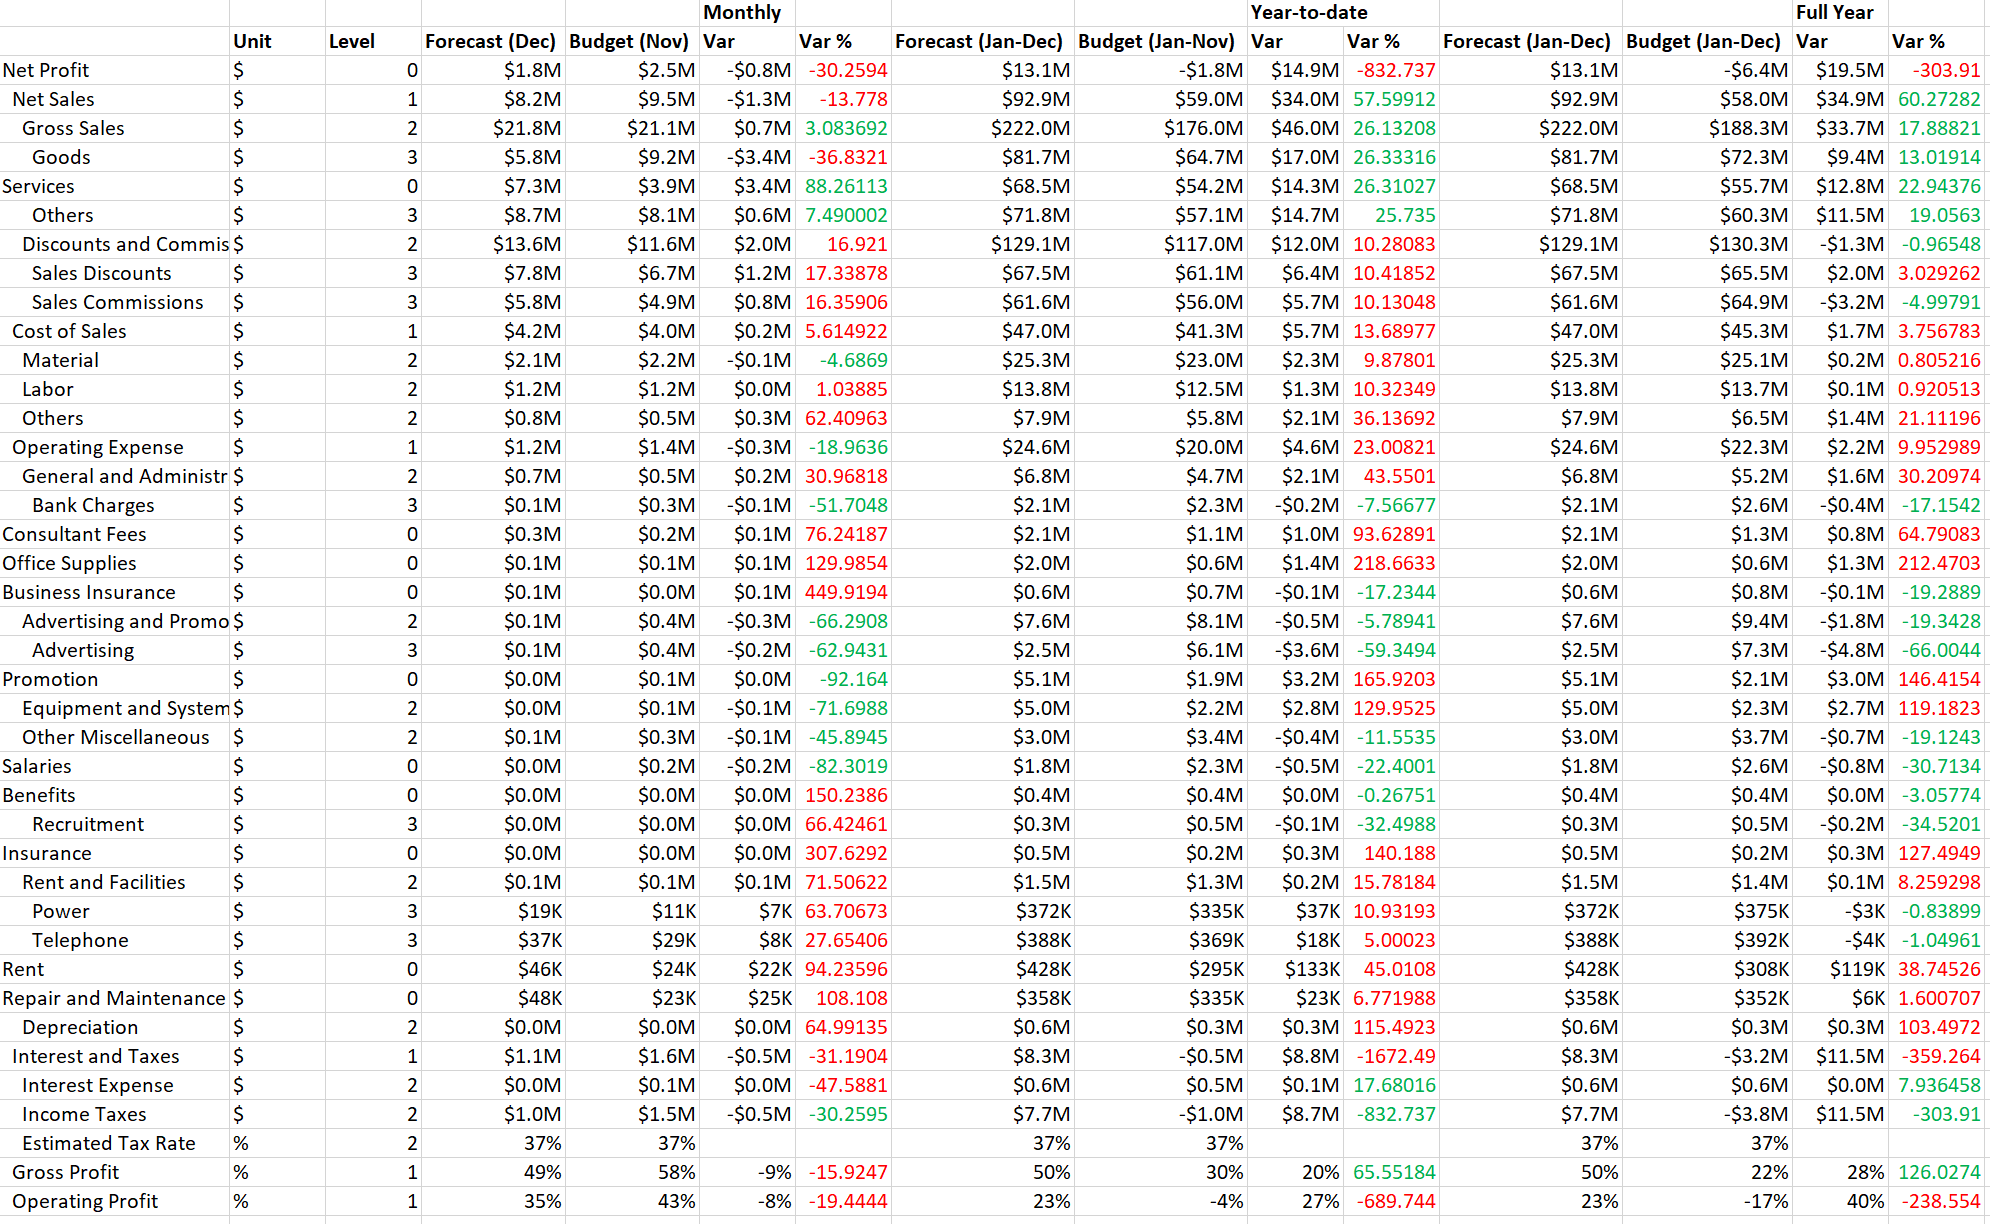
Variance Analysis displays the variance between the Base and Compared series across all nodes in the model.
On clicking the ‘Analyze’ Tab, you will be able to view the Variance Analysis option.
Analyze Tab
The Variance Analysis page is displayed, showing the variance between the Base and Compared data series.
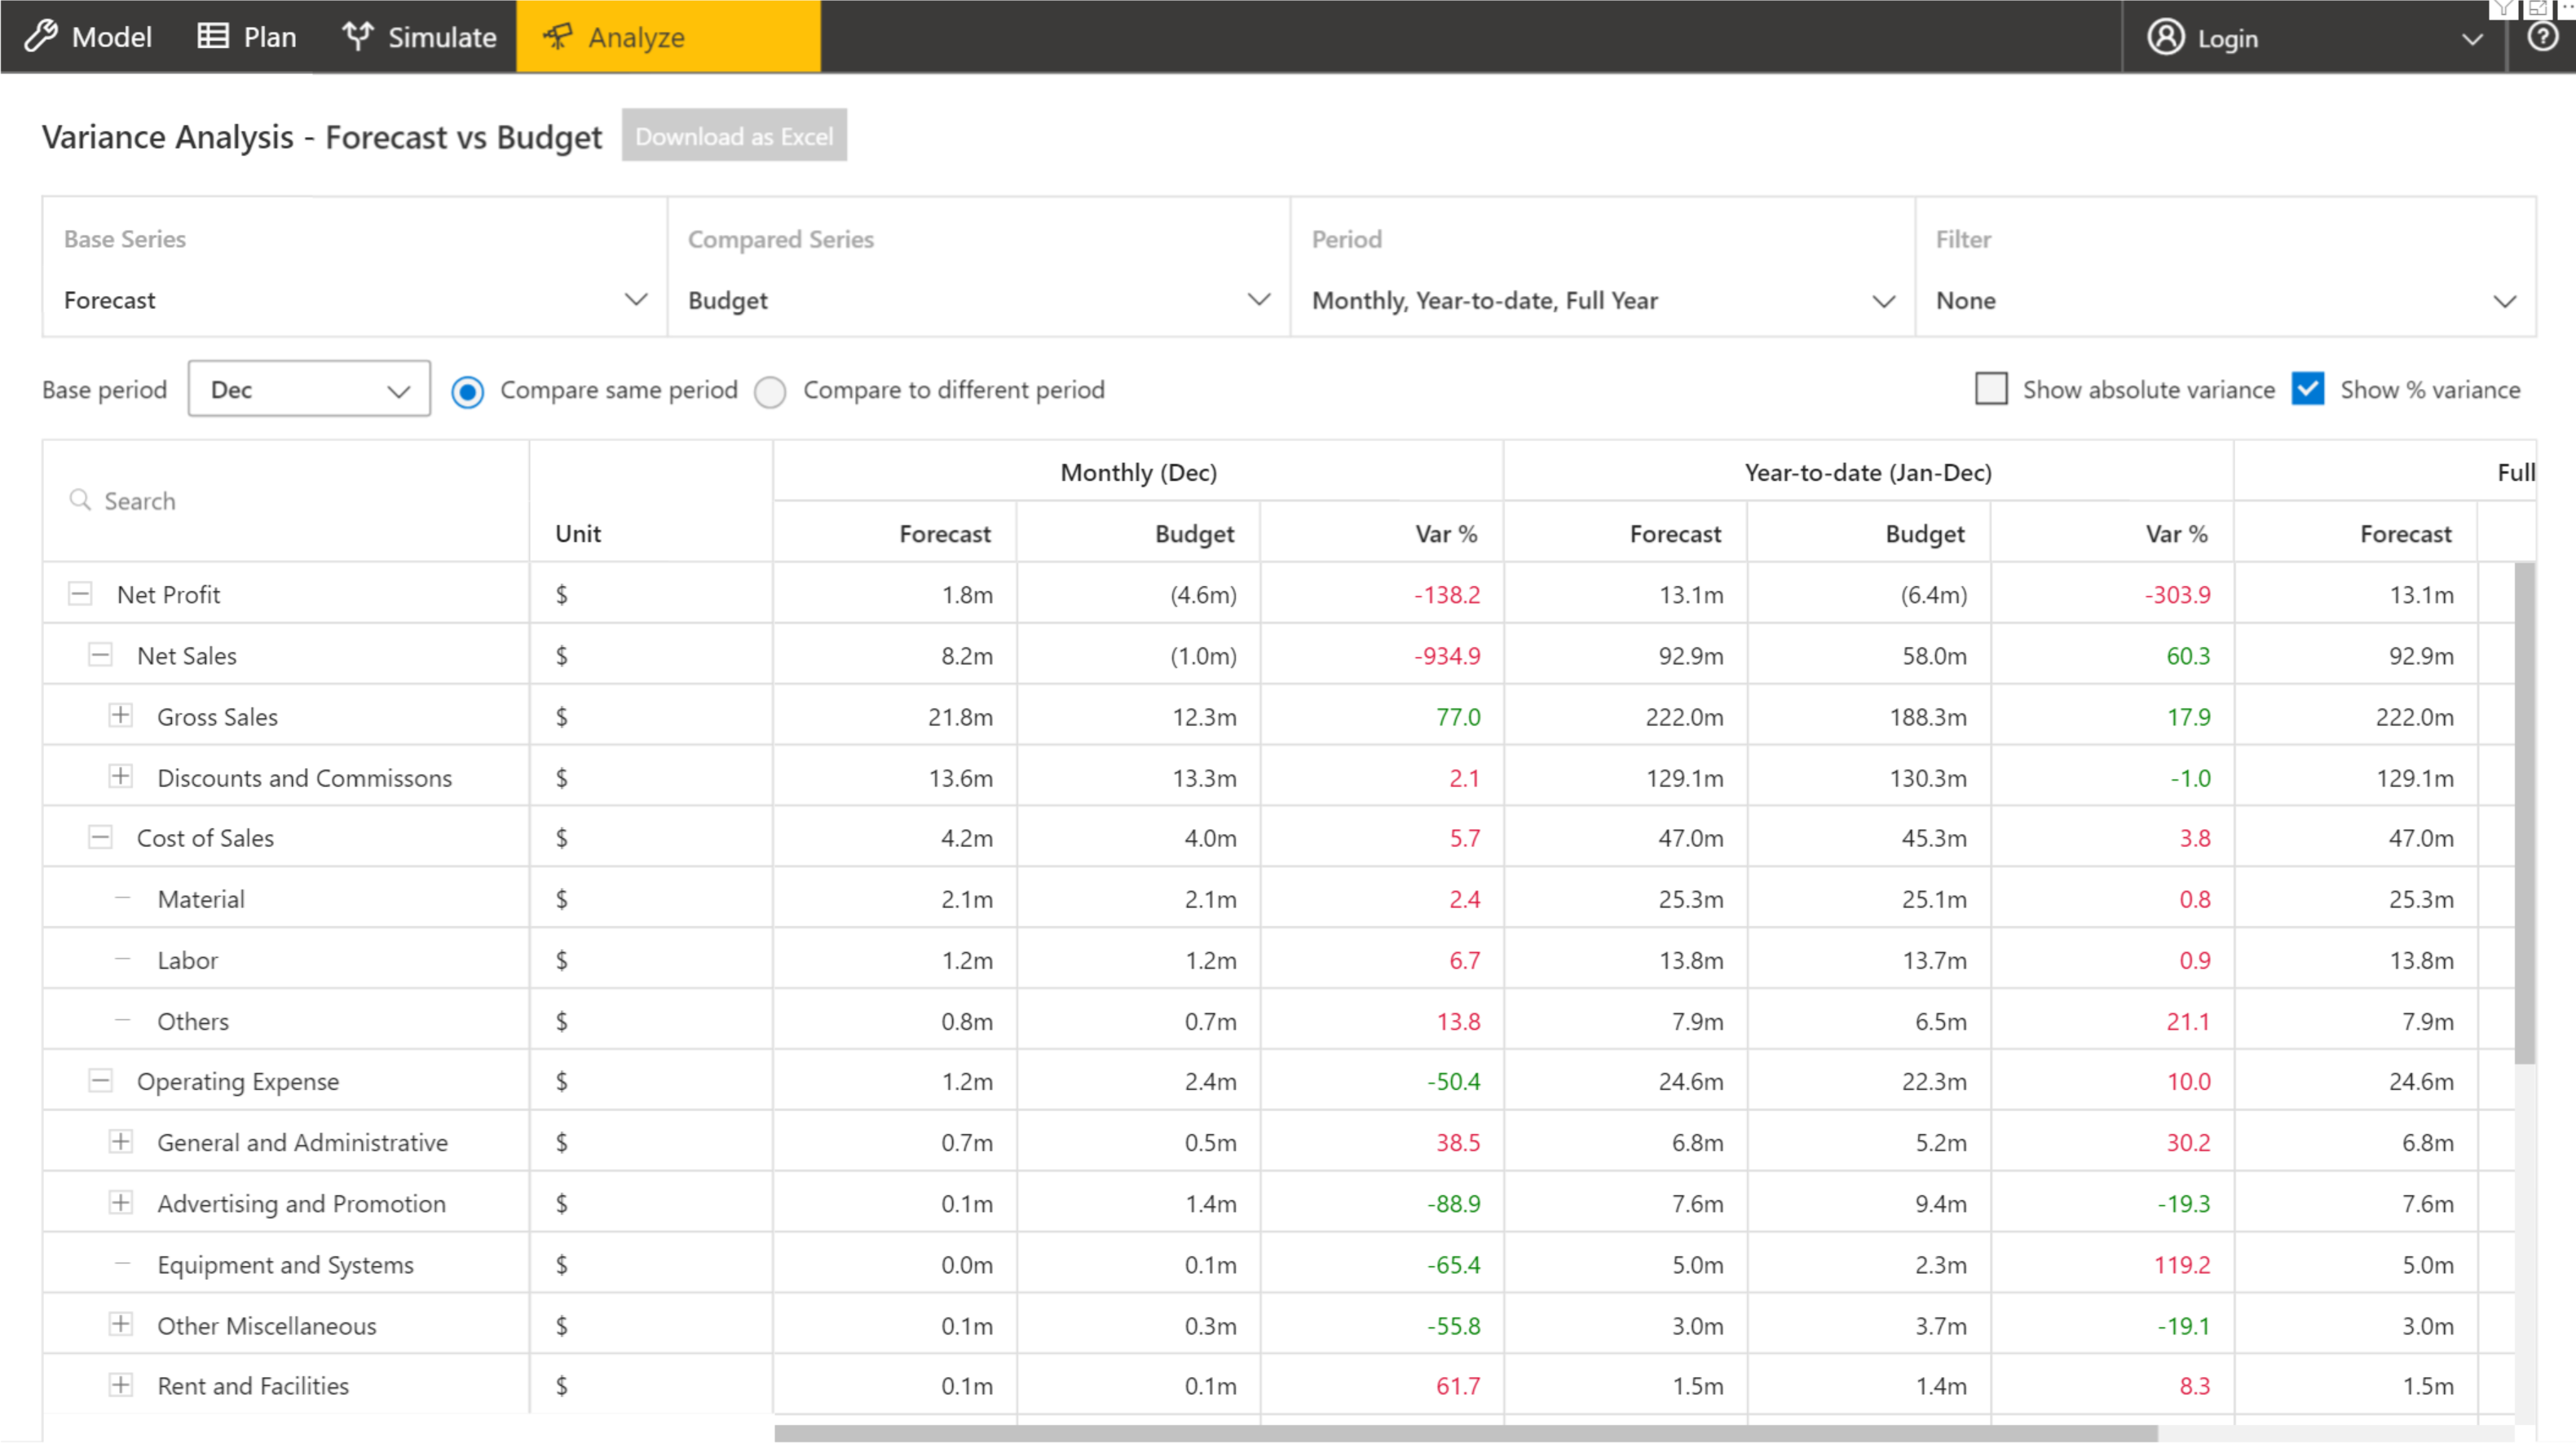
Variance Analysis Page
The series that were created in the ‘Plan’ Tab can also be selected as Base Series or Compared Series by clicking on the drop-down.
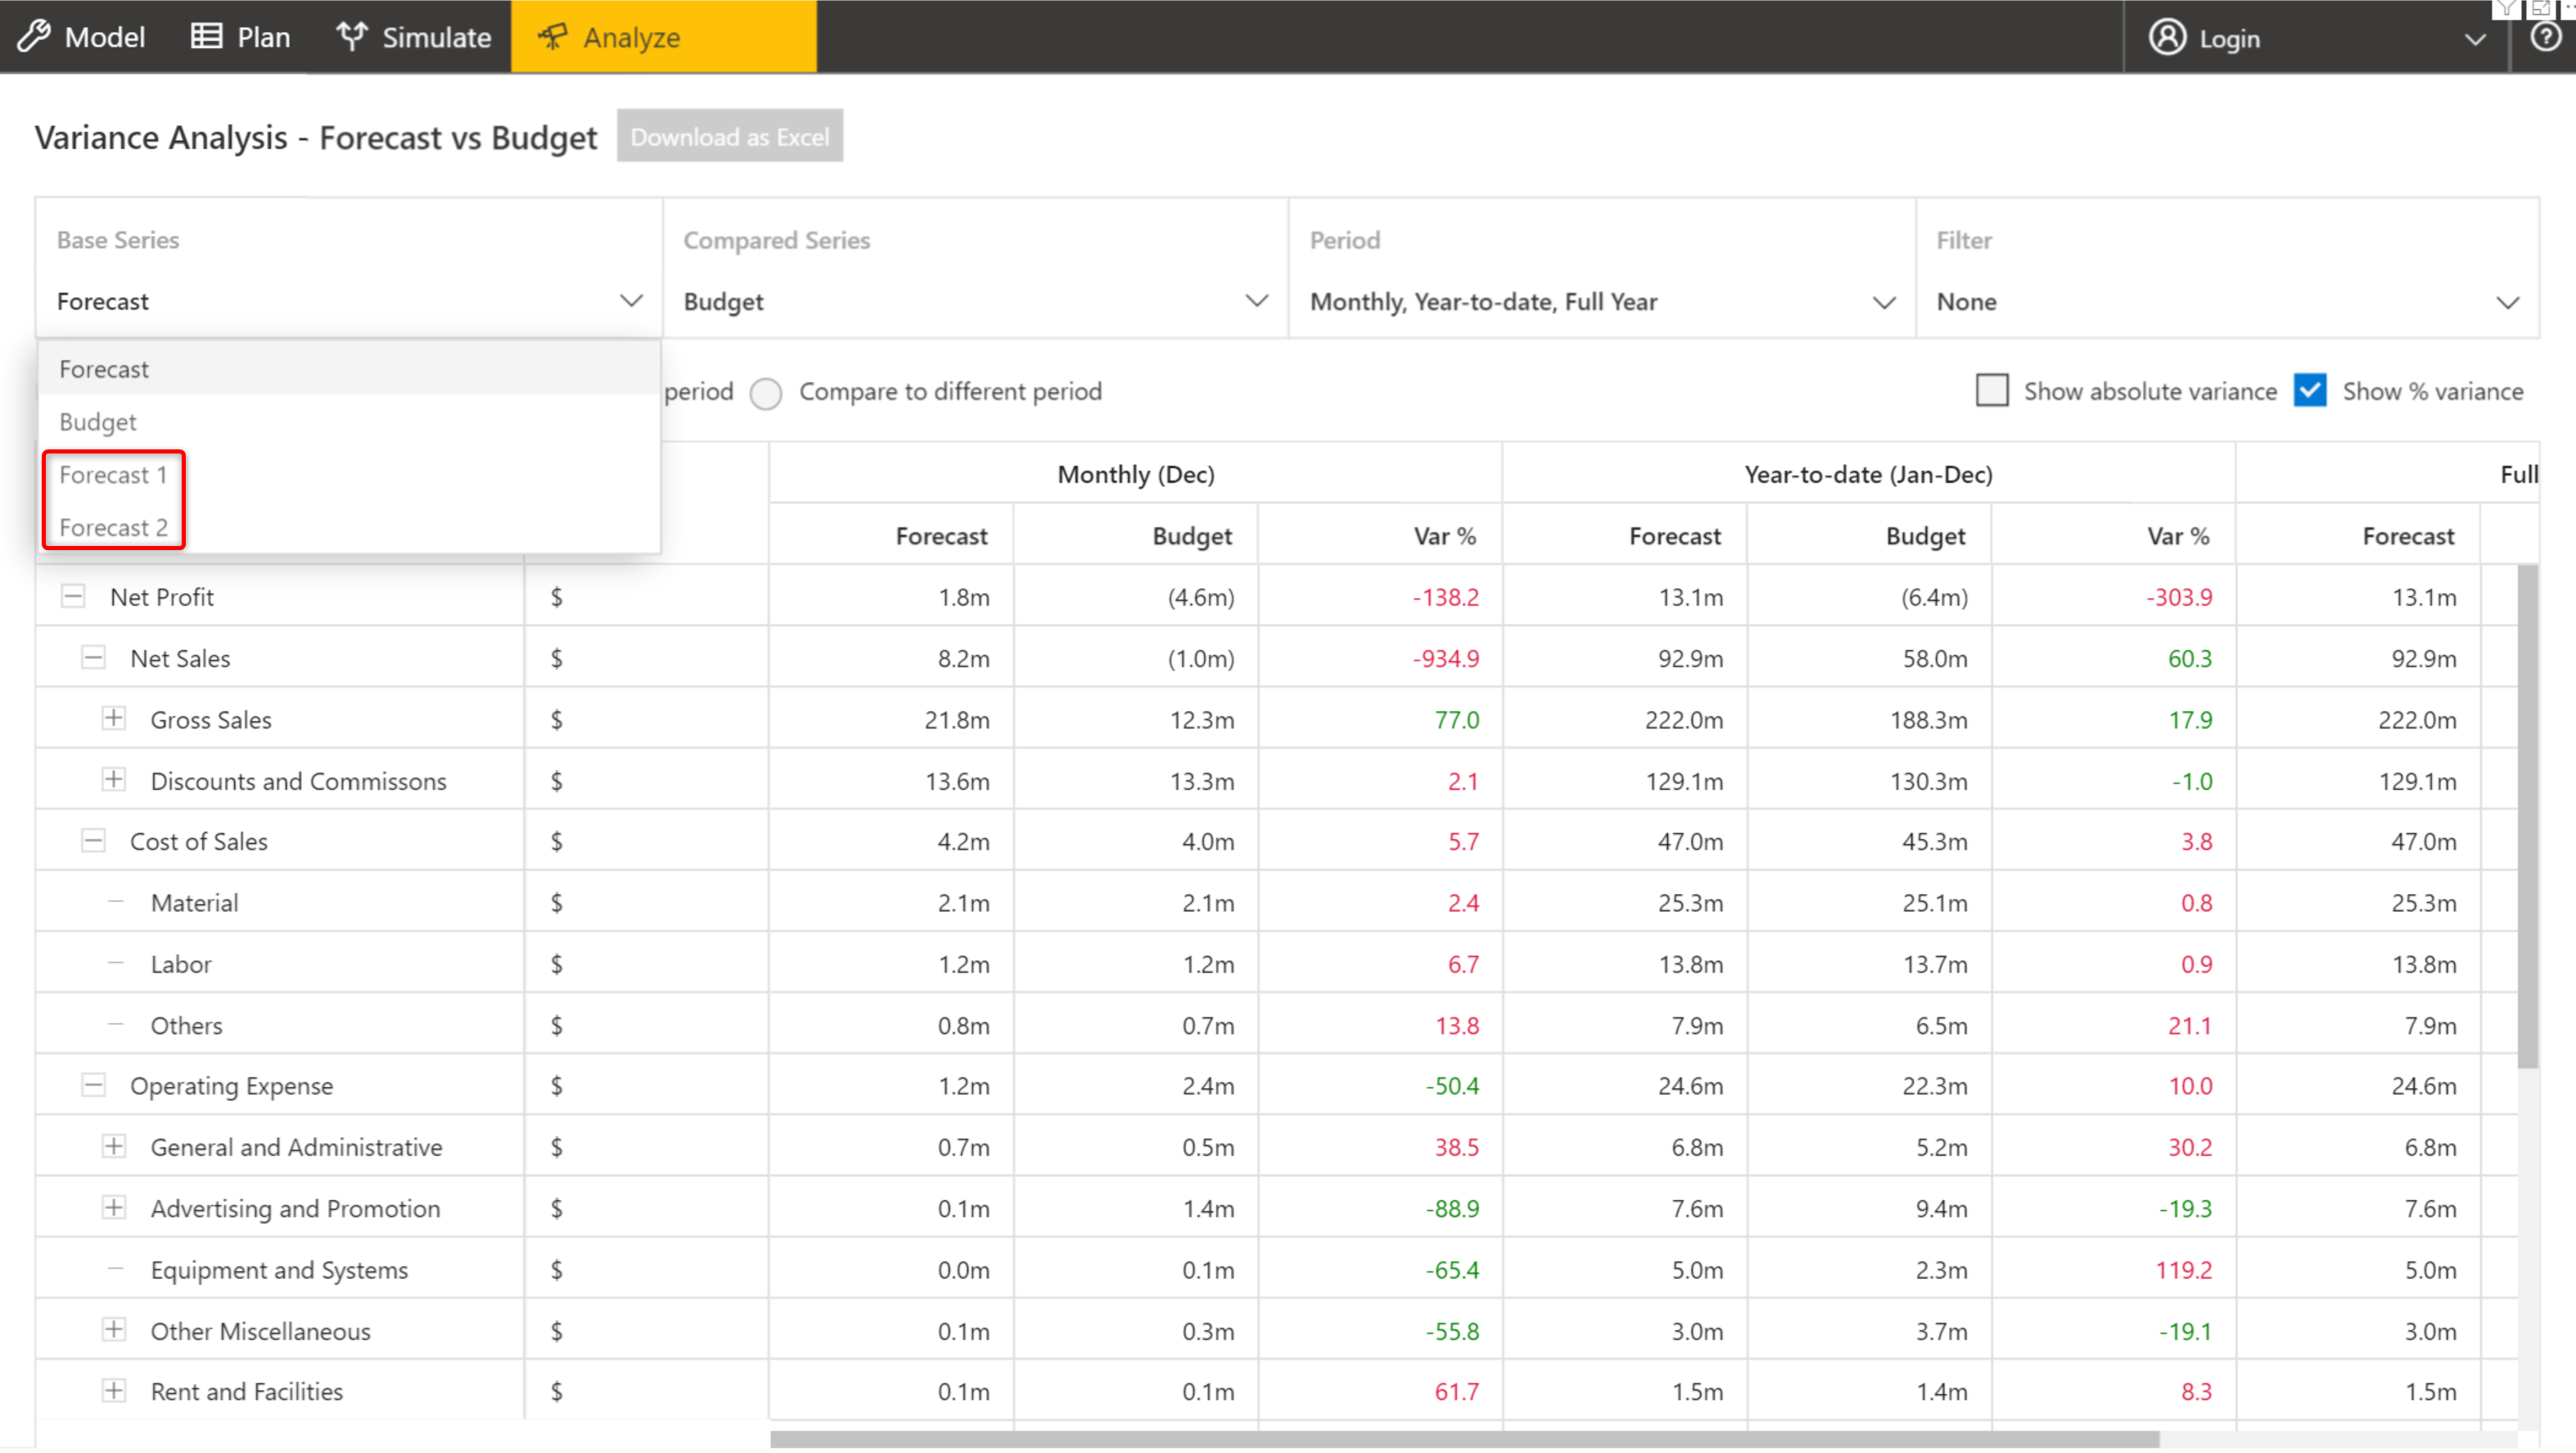
Choosing series created using Plan Tab
The period across which the two series are to be compared can be customized by clicking on the drop-down in the ‘Period’ field.
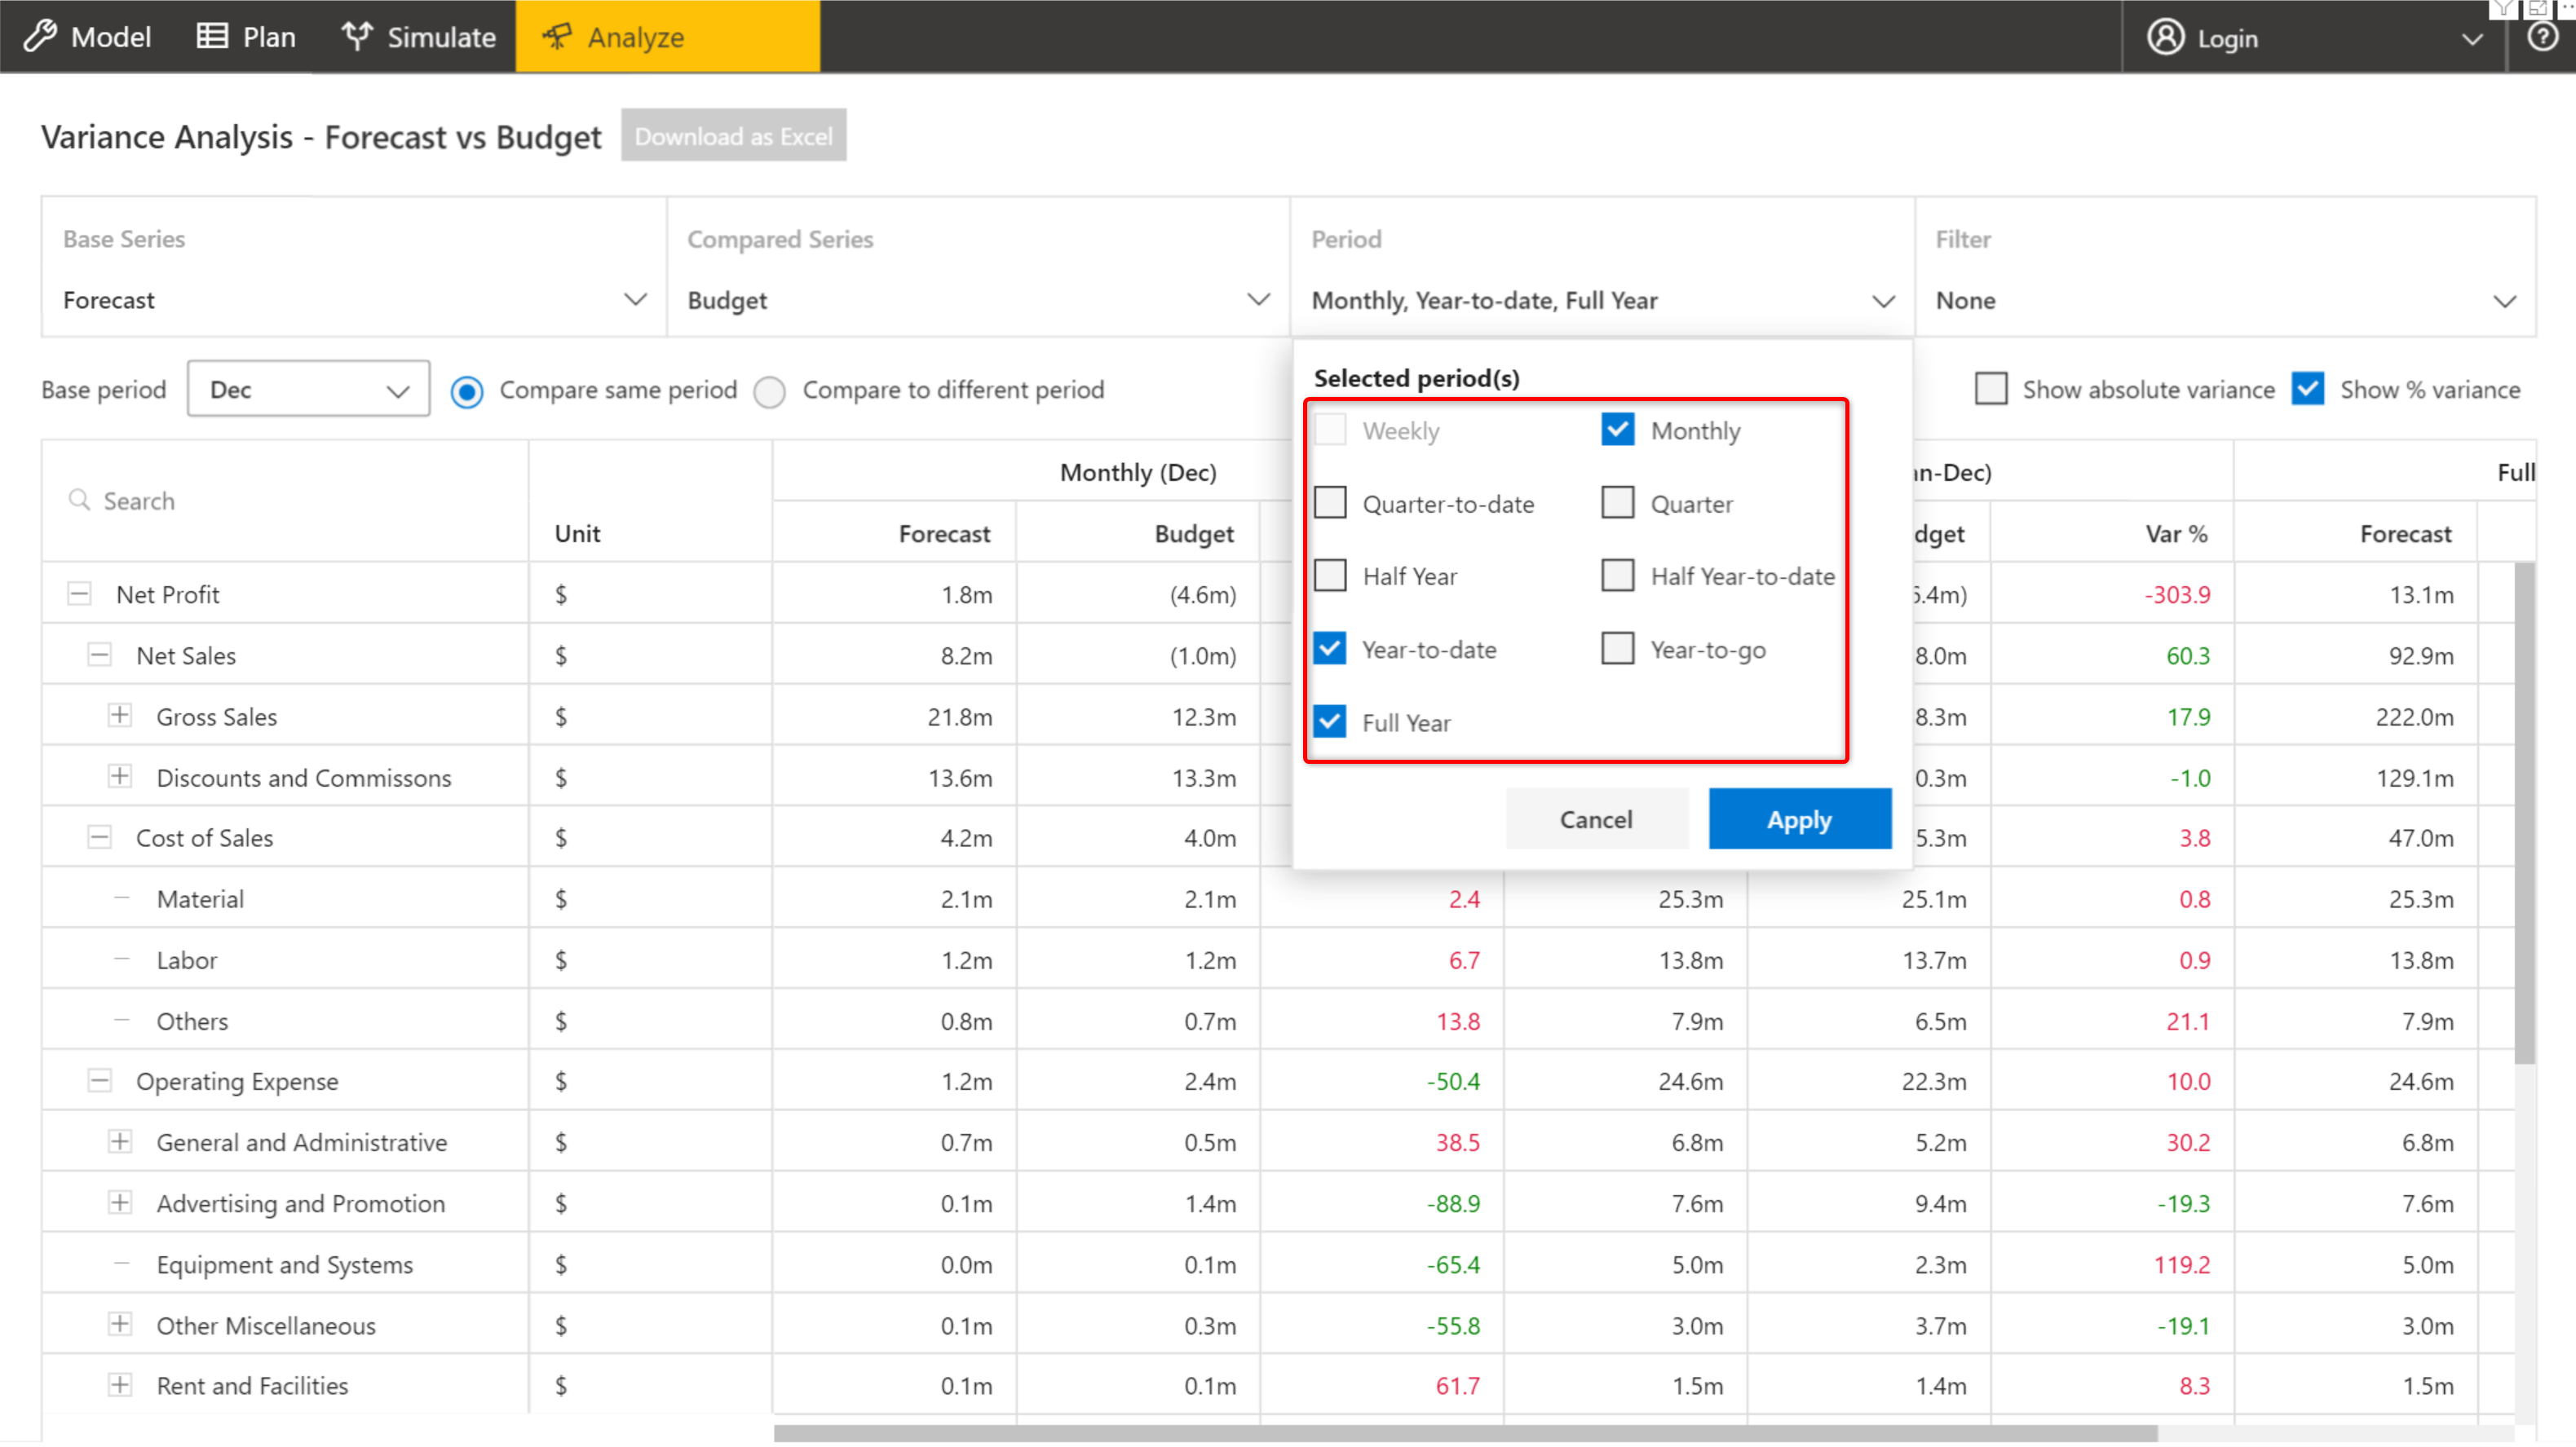
Customizing periods
Variance analysis can also be performed for the two series across different periods by selecting the ‘Compare to different period’ option and choosing the period in the drop-down.
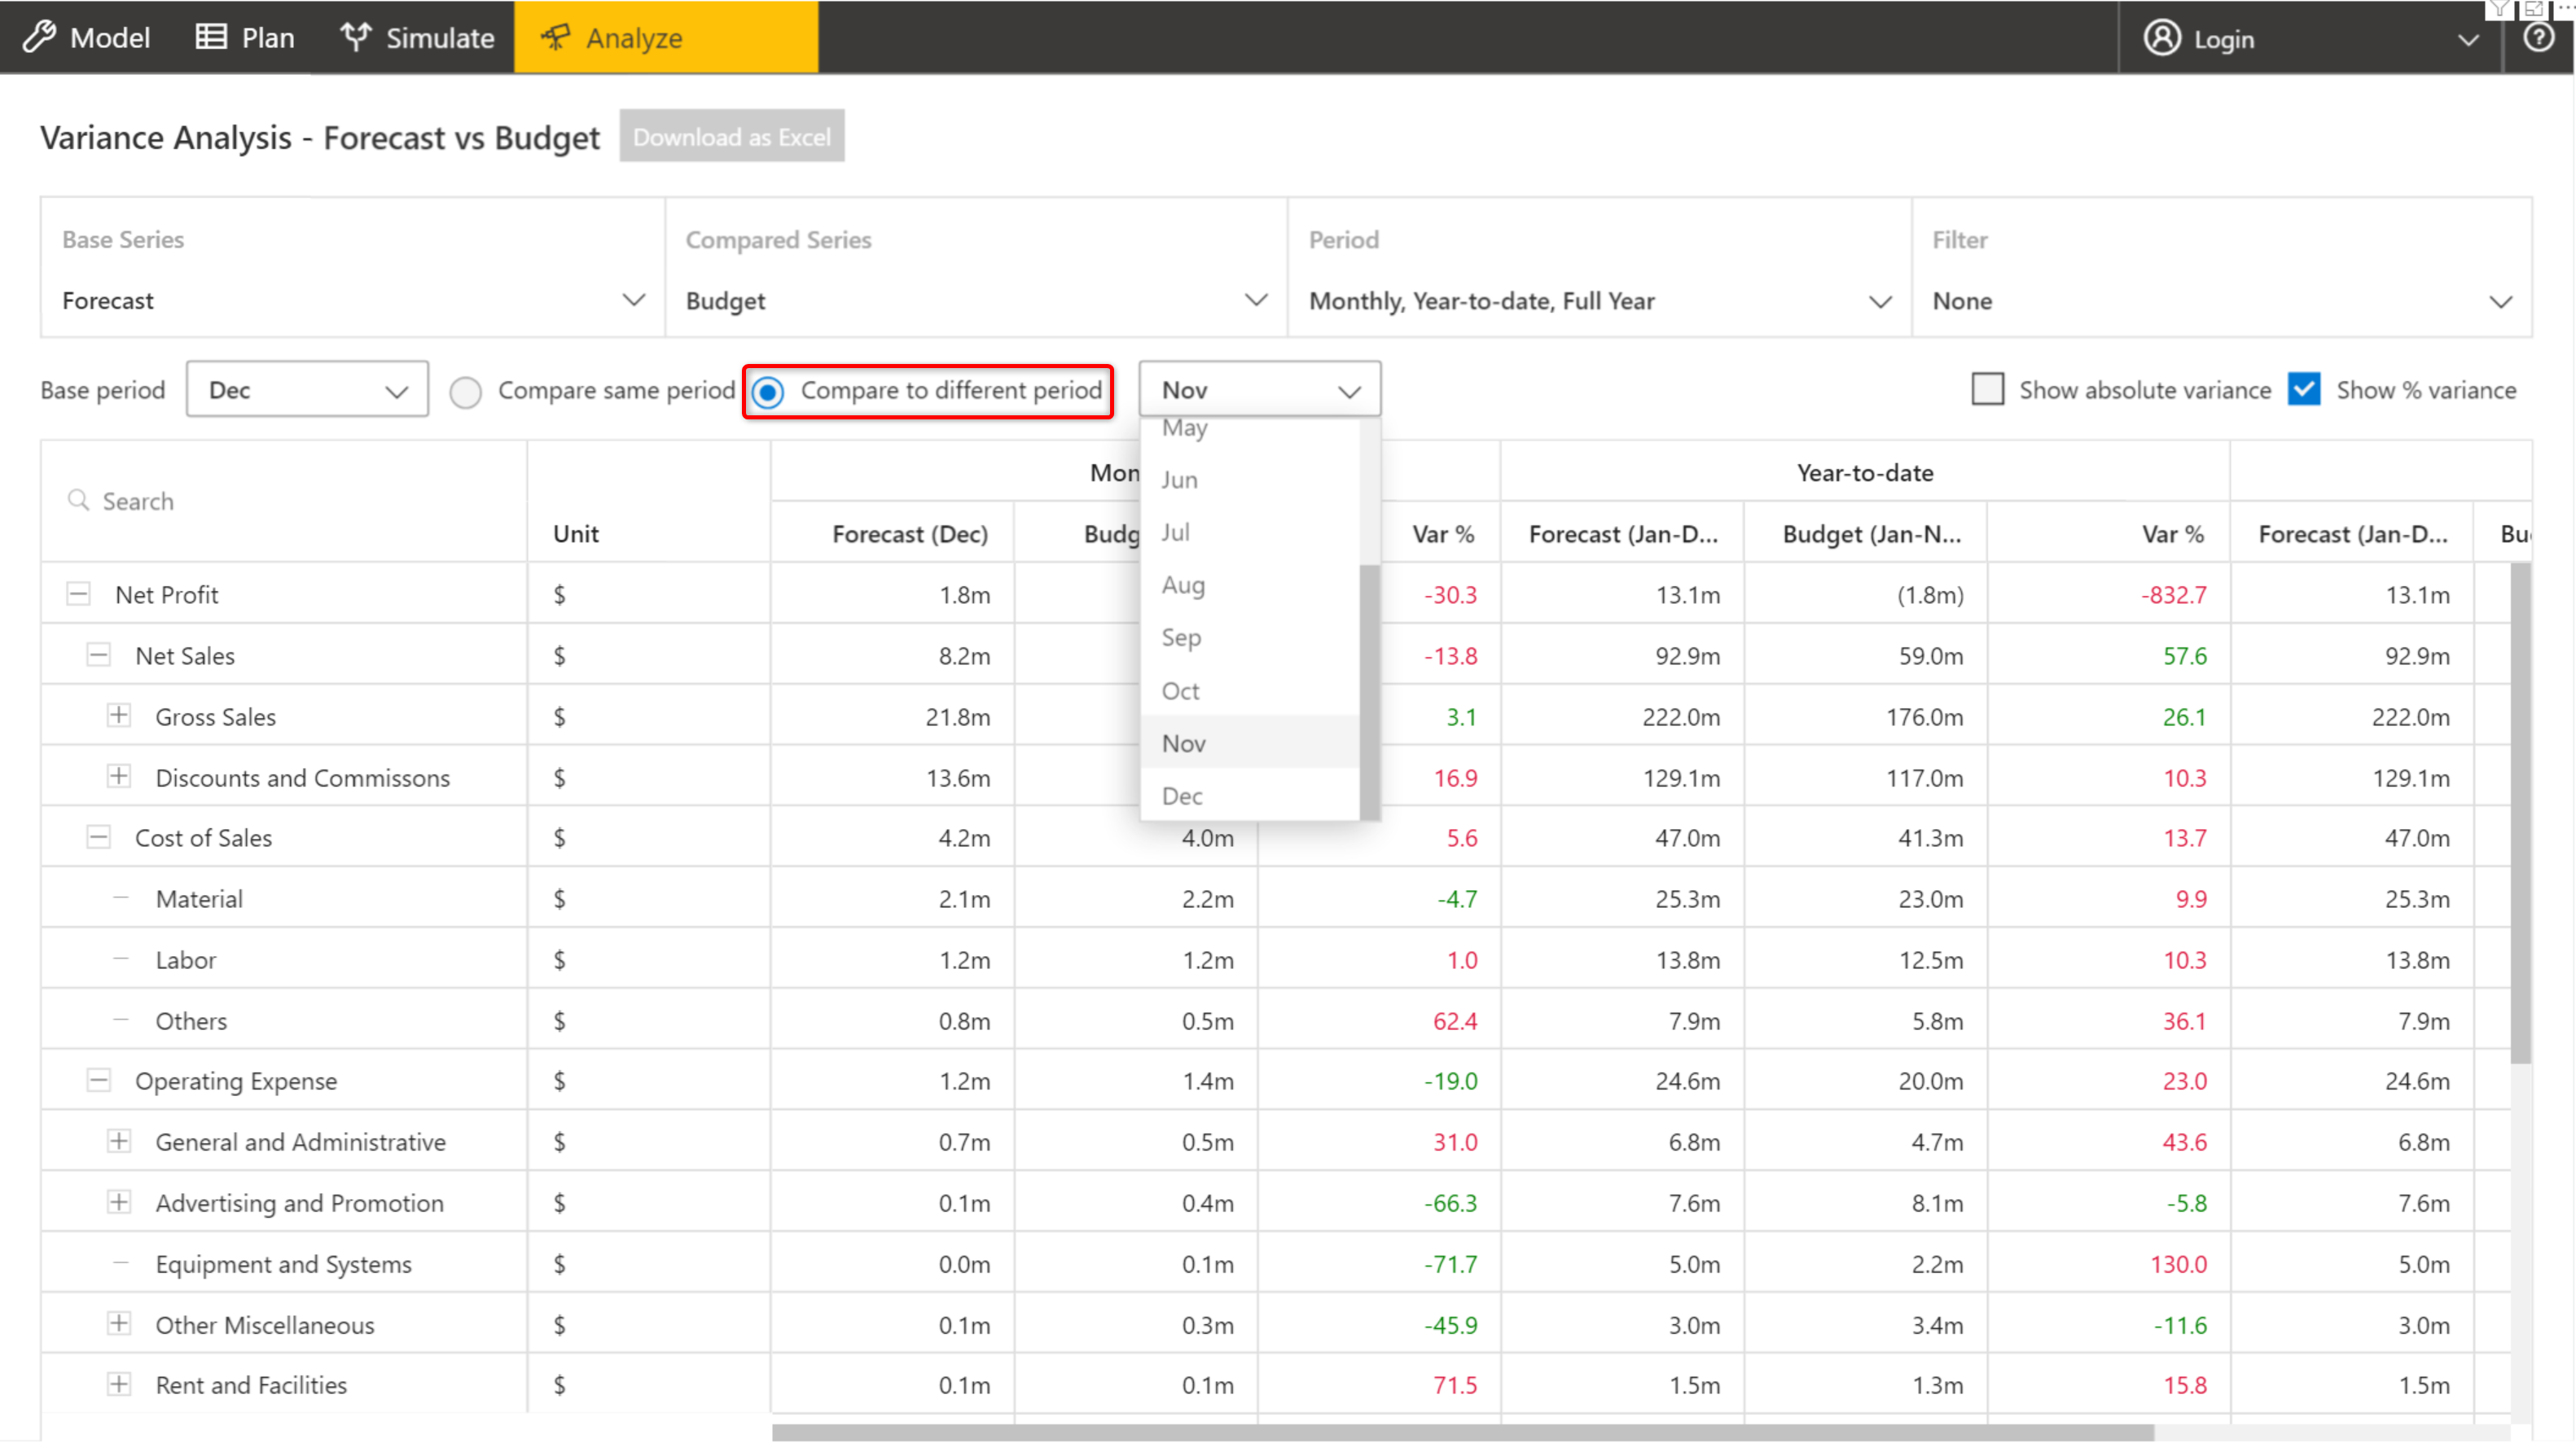
Comparing across different periods
It is to be noted that Base Series and Compared Series cannot be same when comparing for the same Base Period. However, when comparing across different periods Base Series and Compared Series can be same.
The ‘Filter’ option has the ability to filter the nodes based on the ‘Variance’ values. The number of nodes and the period can be selected by the user.
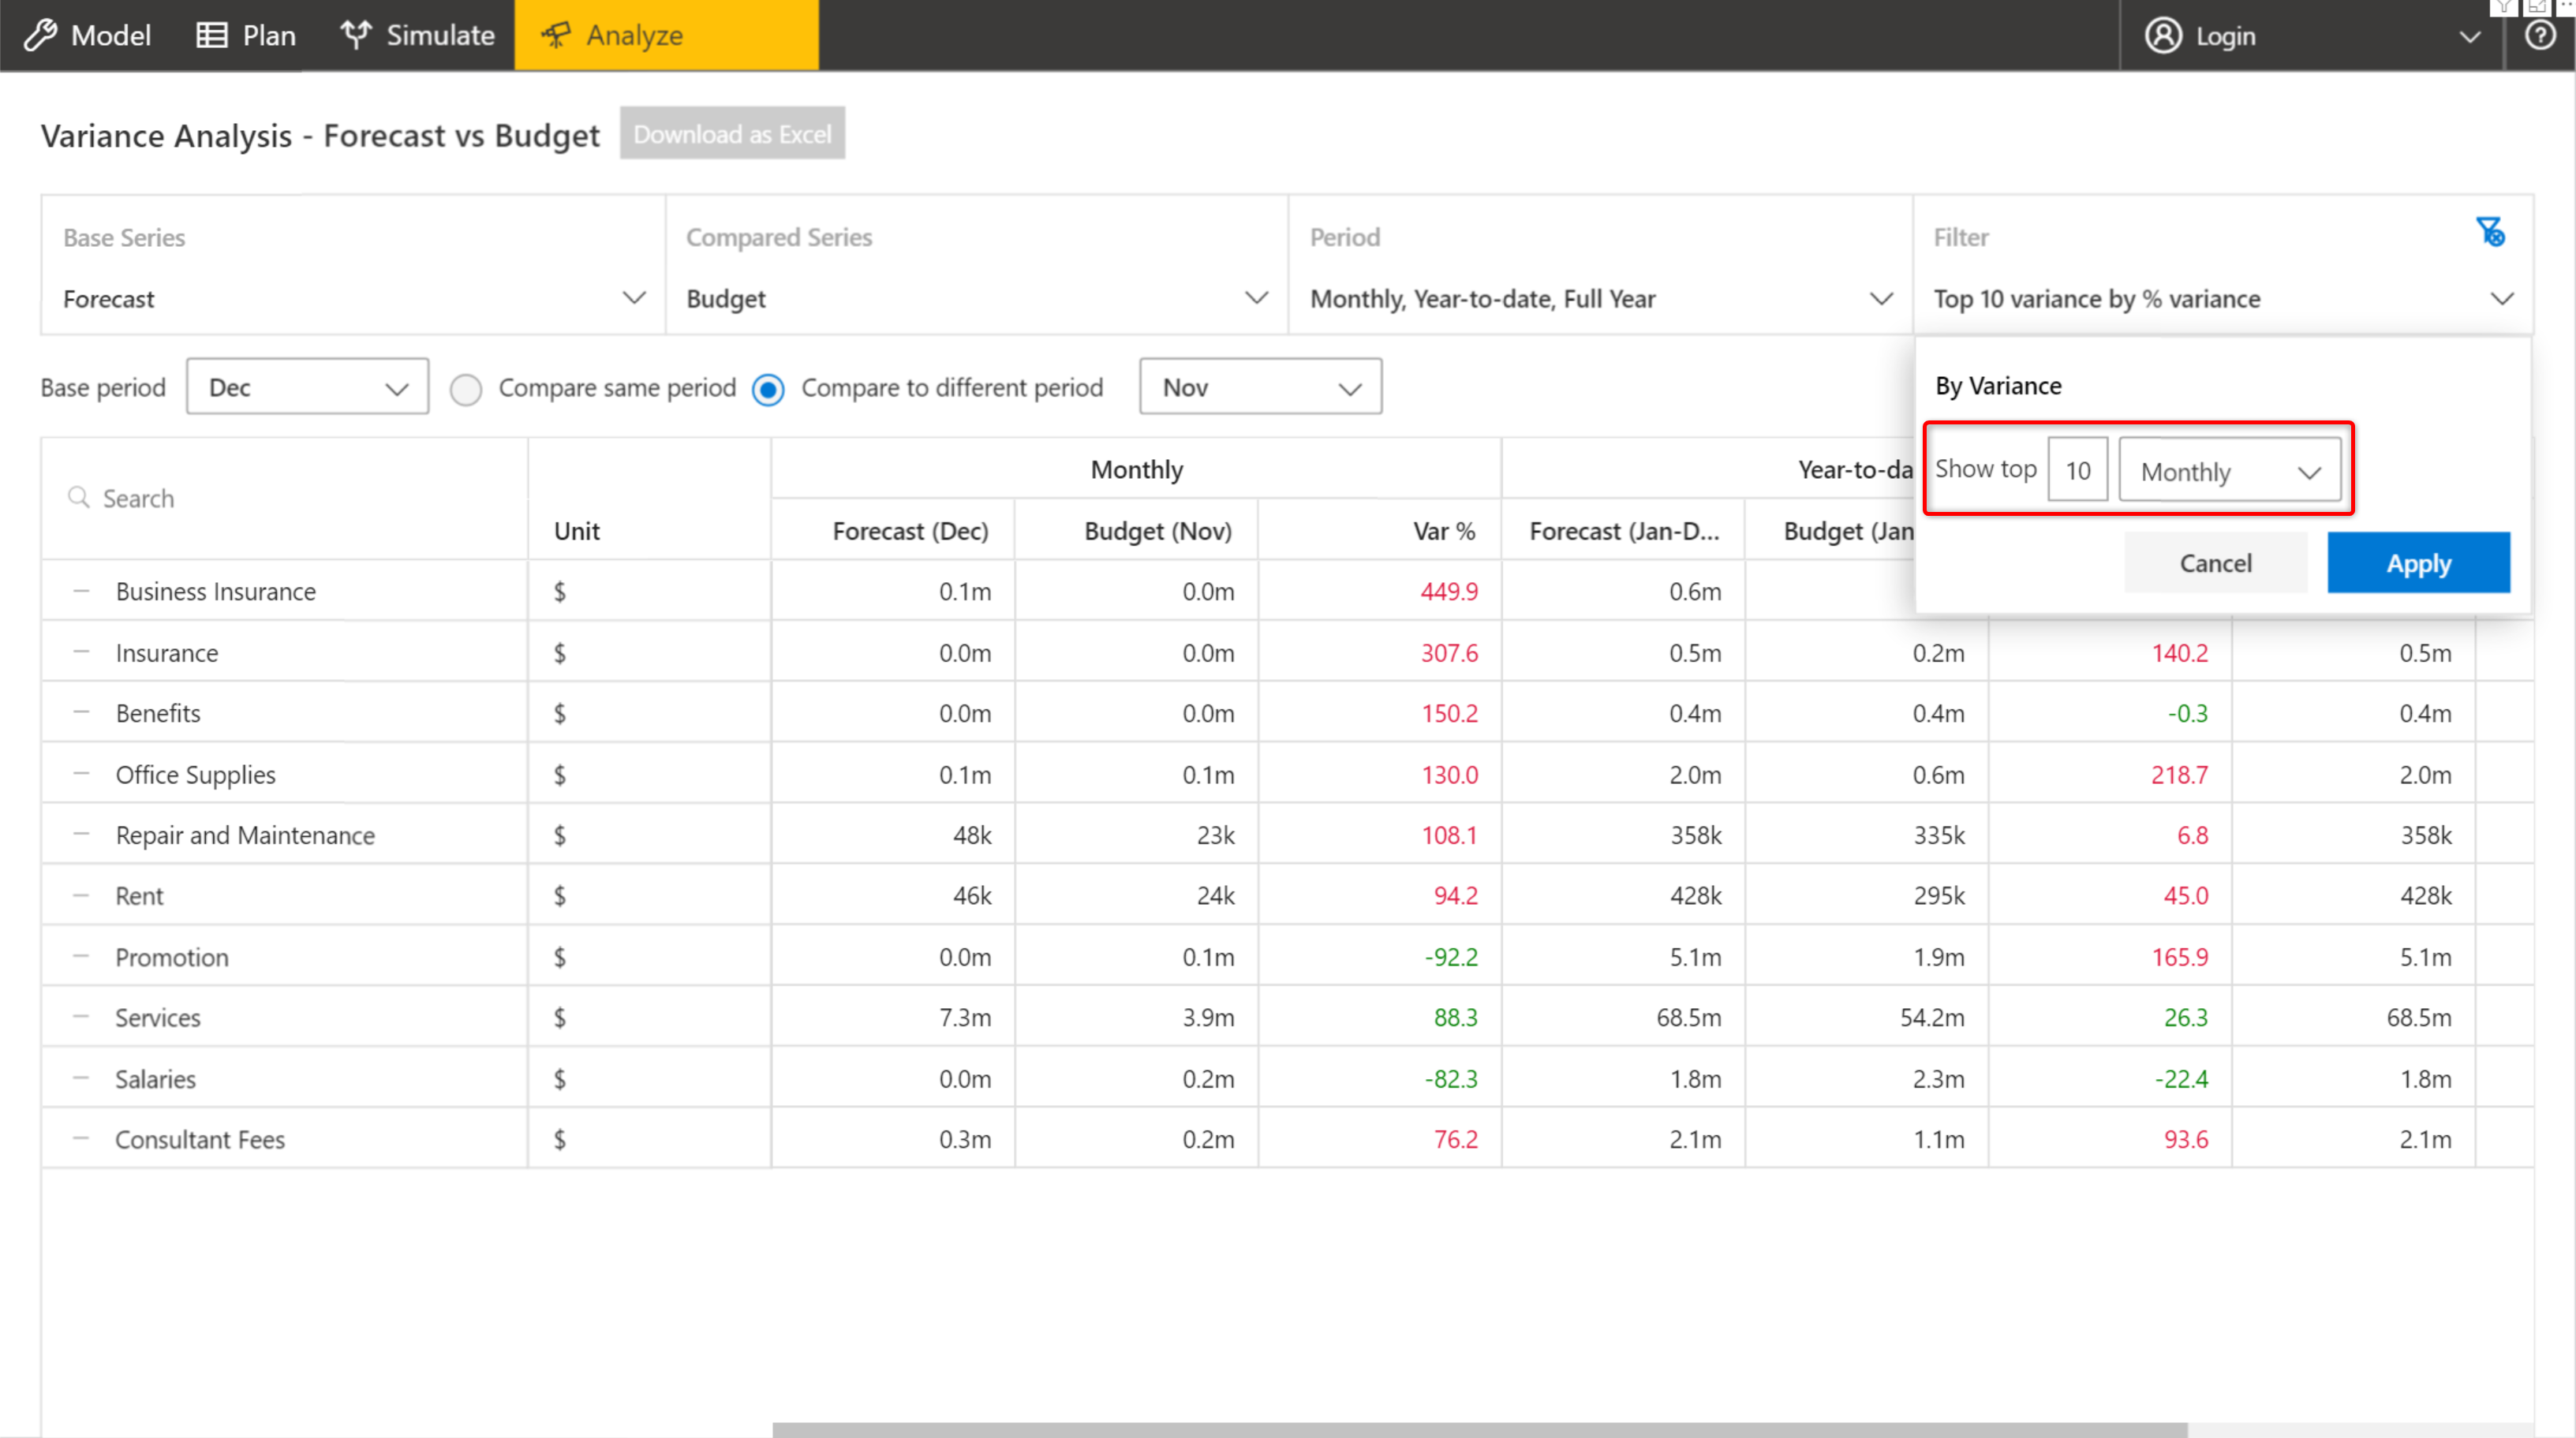
Filtering the top 10 nodes based on monthly variance values
The user can also choose to display either Absolute Variance or % Variance or both by selecting the appropriate checkboxes.
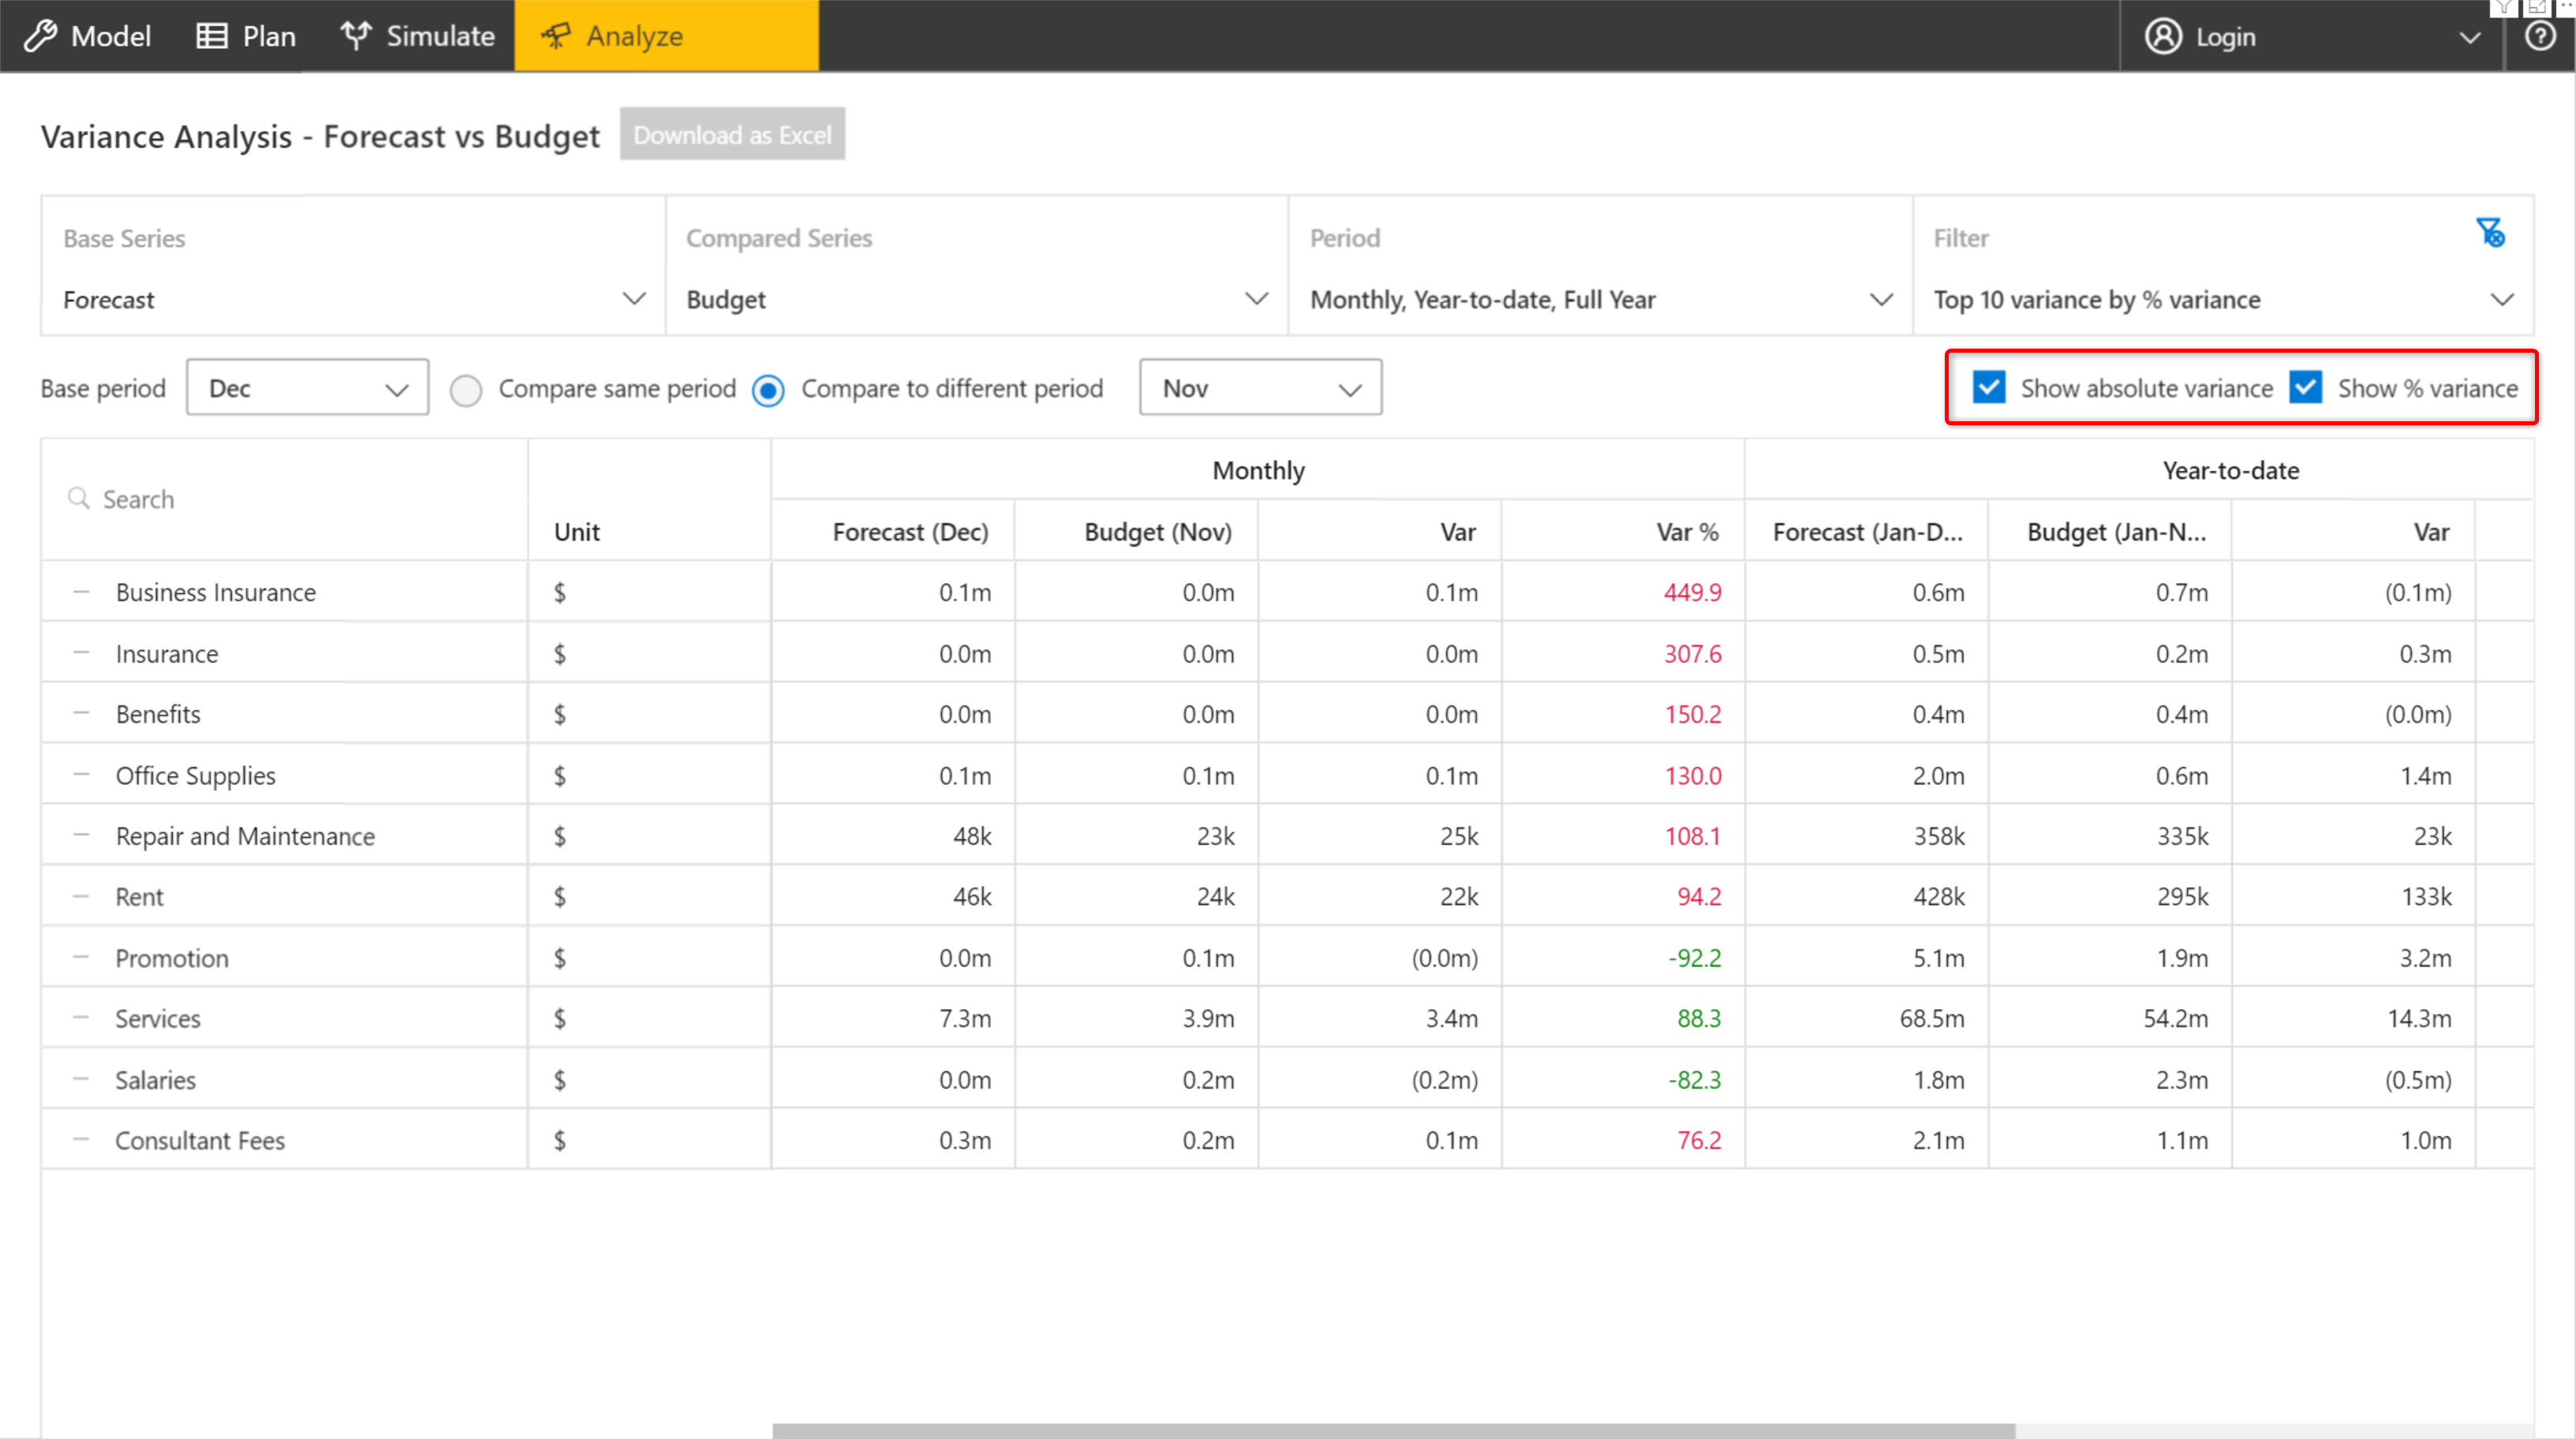
Displaying Absolute Variance and/or % Variance values
It is possible to download the results of the analysis as an Excel file when using Power BI Service.
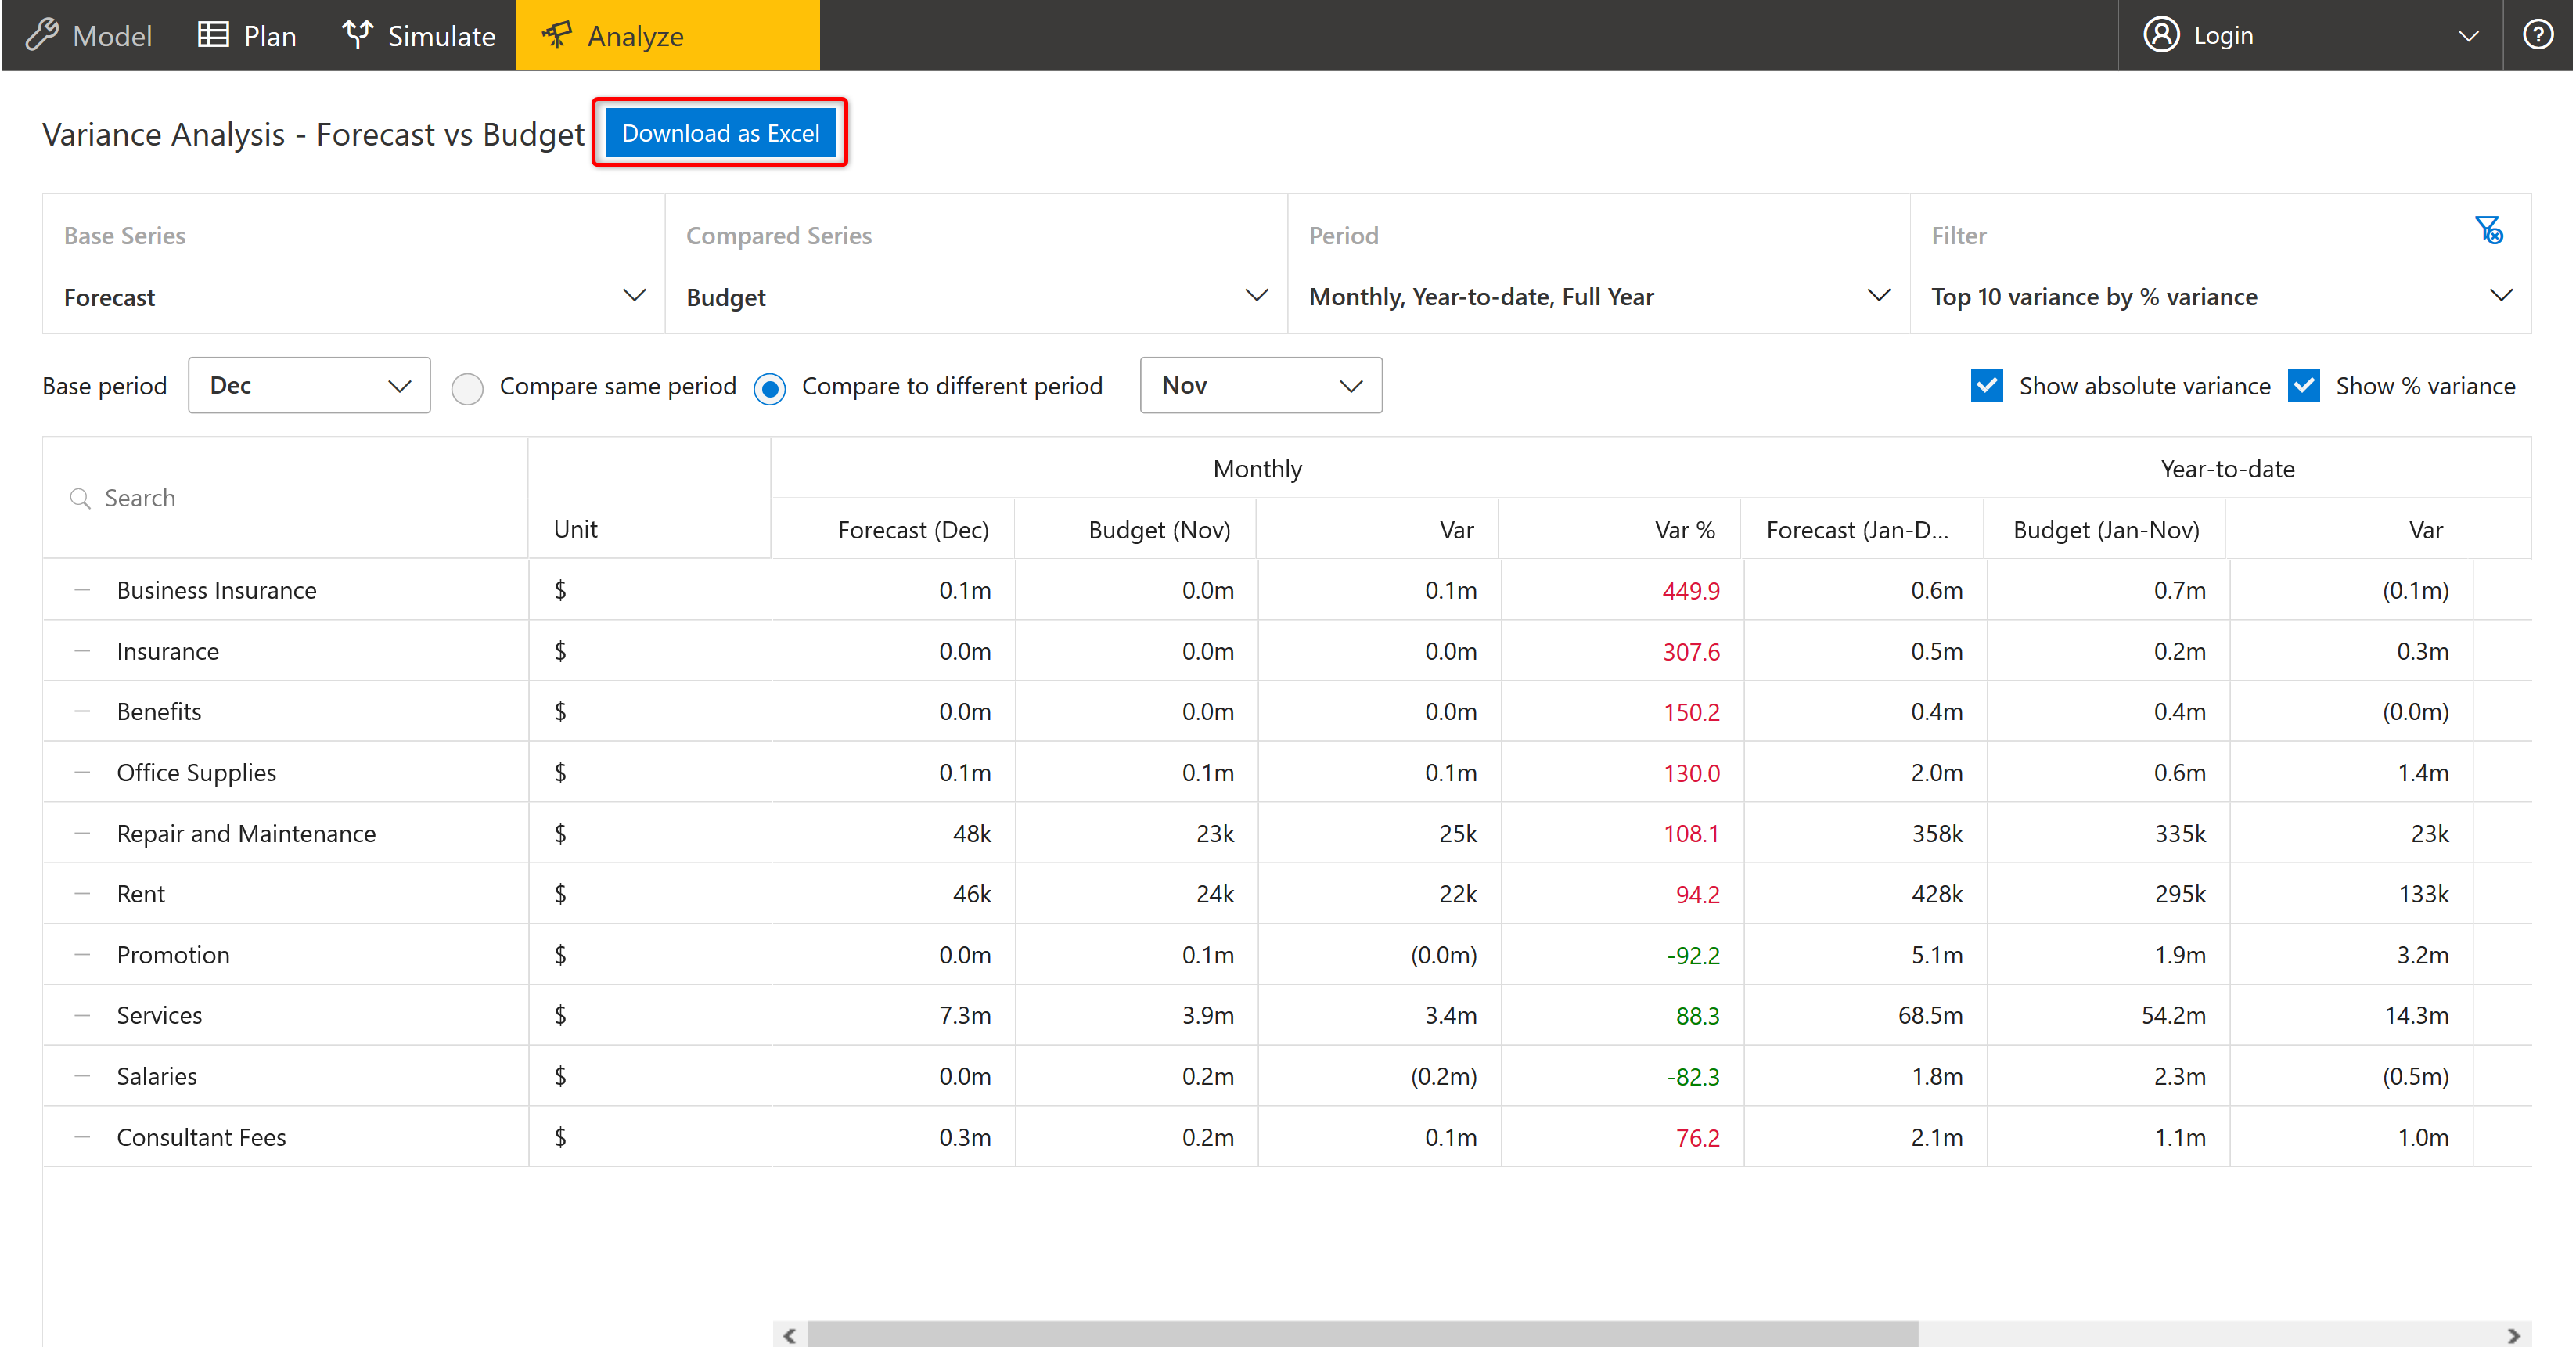
Downloading as Excel
The downloaded analysis looks like the one shown below.
Downloaded analysis result