Plan Tab
With the Plan Tab, it is possible to create new plans based on existing data (e.g. prior period actuals or existing budget) or from scratch (Zero-based budgeting).
Understanding the features
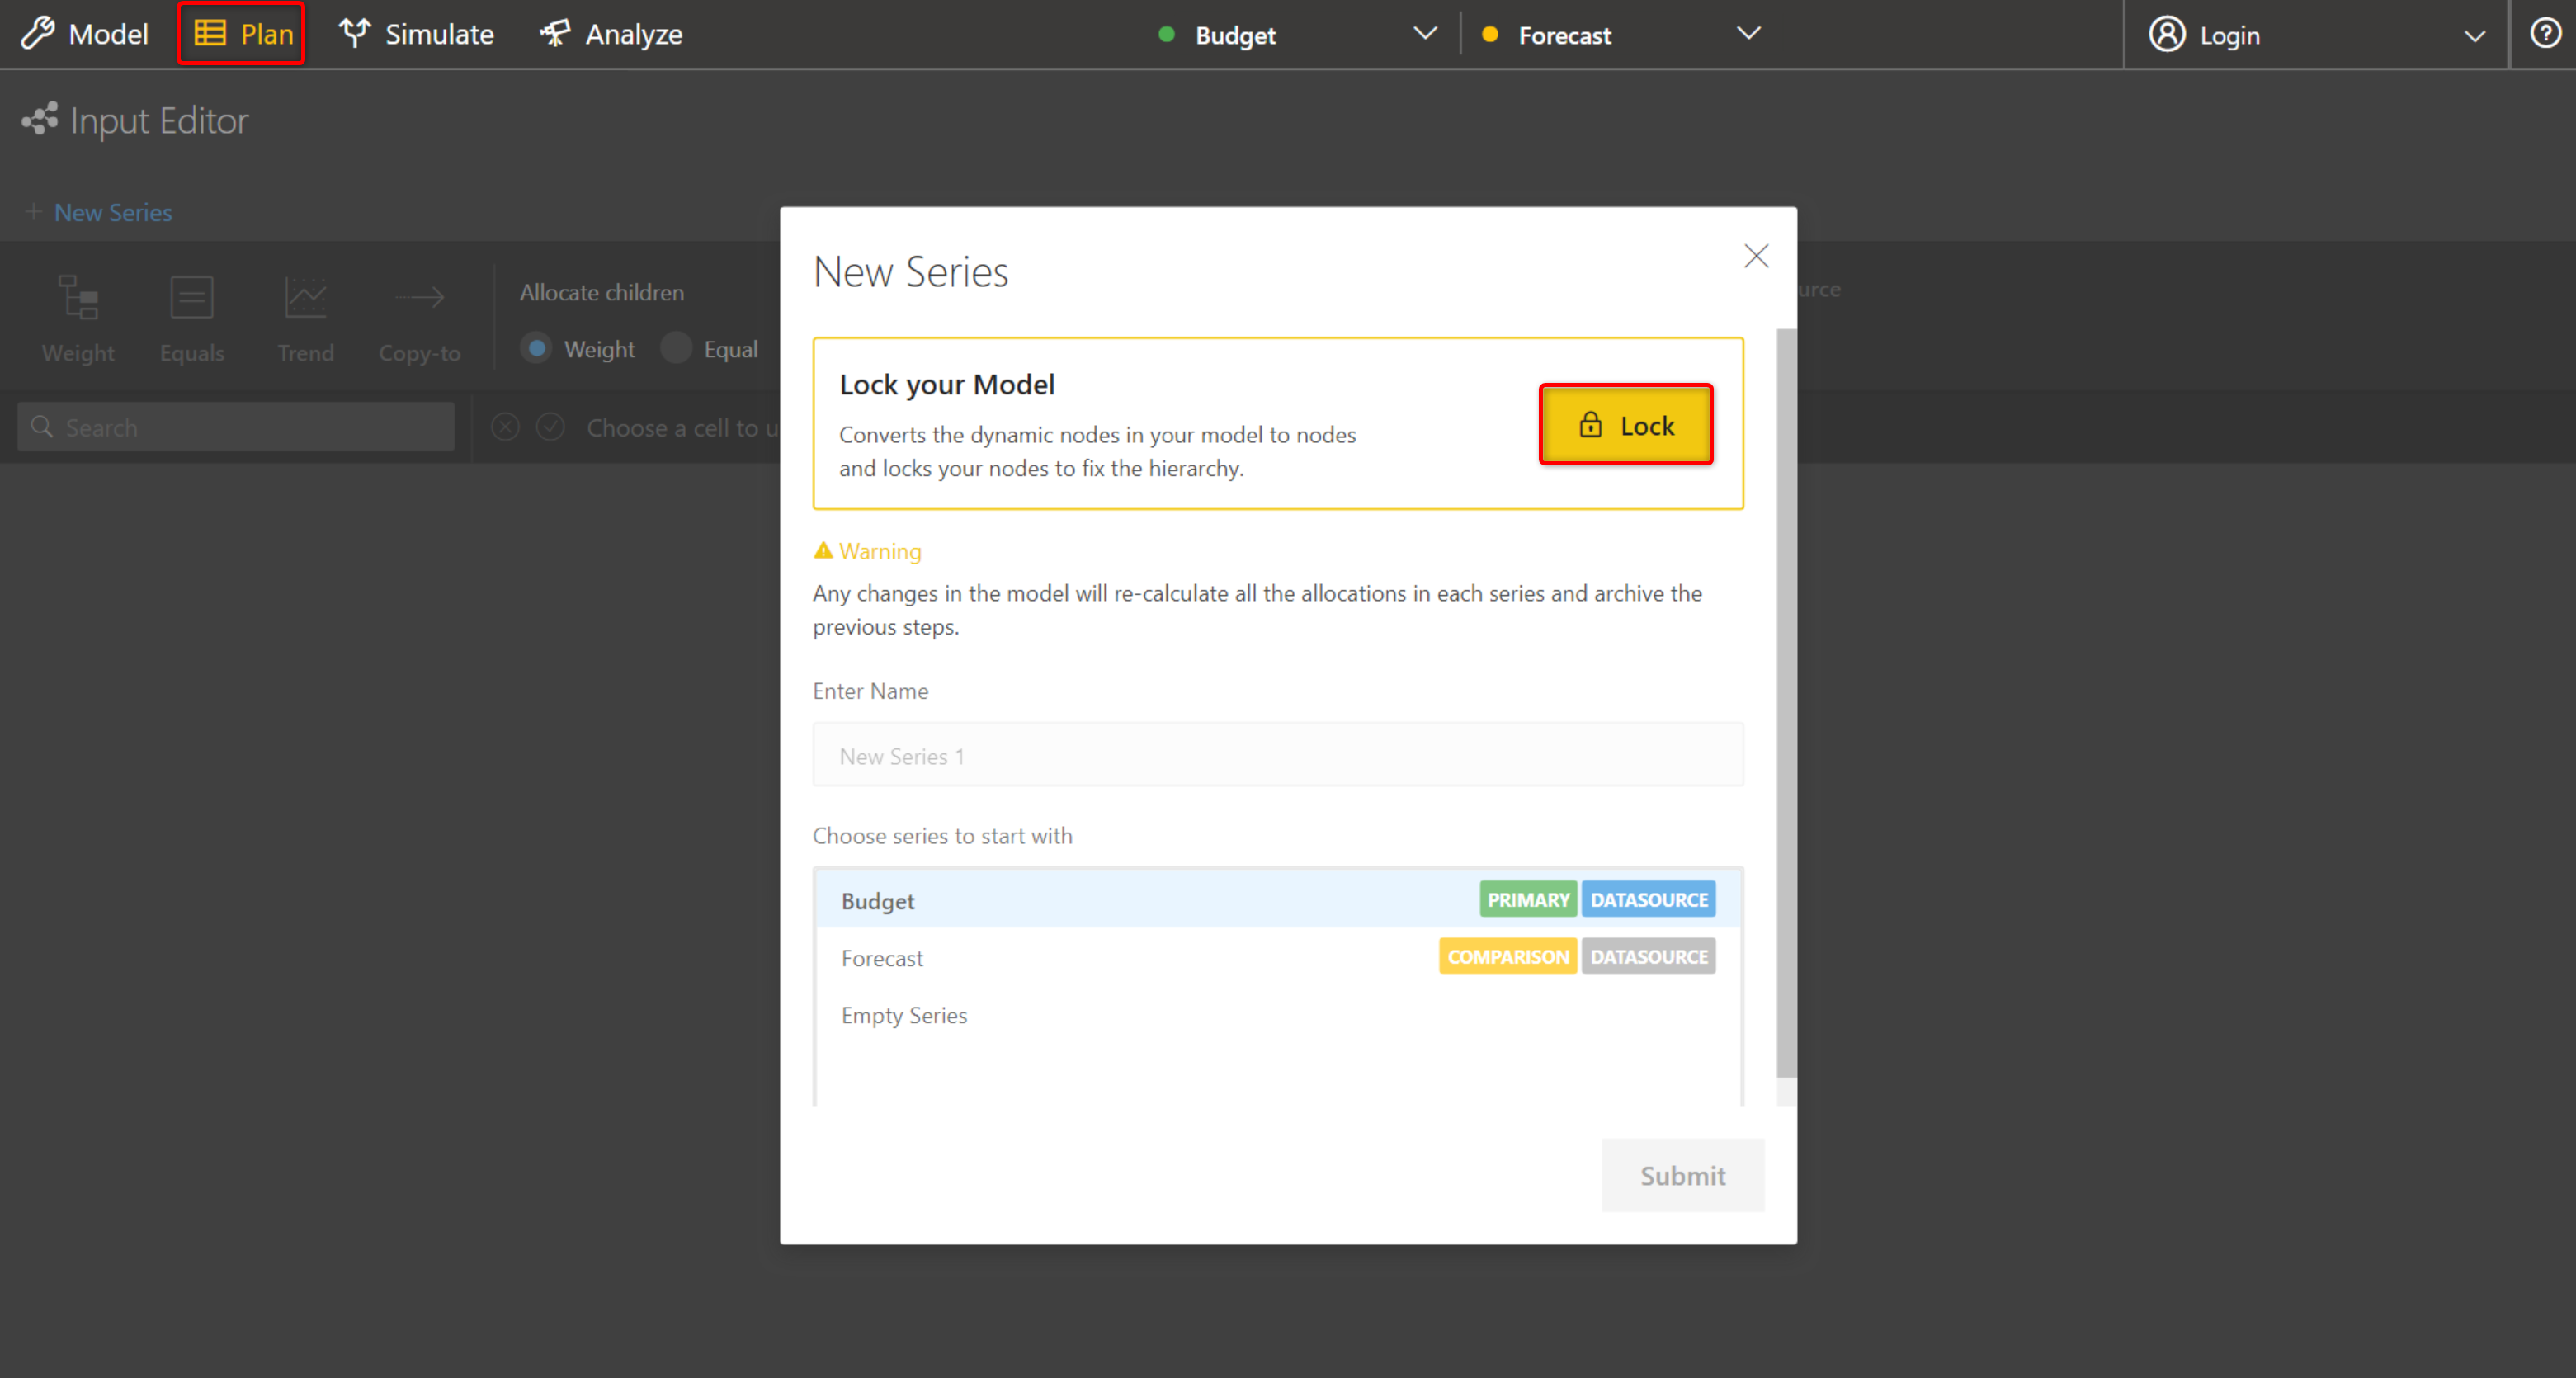
On clicking the Plan Tab, the ‘New Series’ popup opens. Before creating a new series the user is required to click on the ‘Lock’ button. This ensures that the node hierarchy is fixed and no structural changes are possible unless unlocked again.
Locking the model
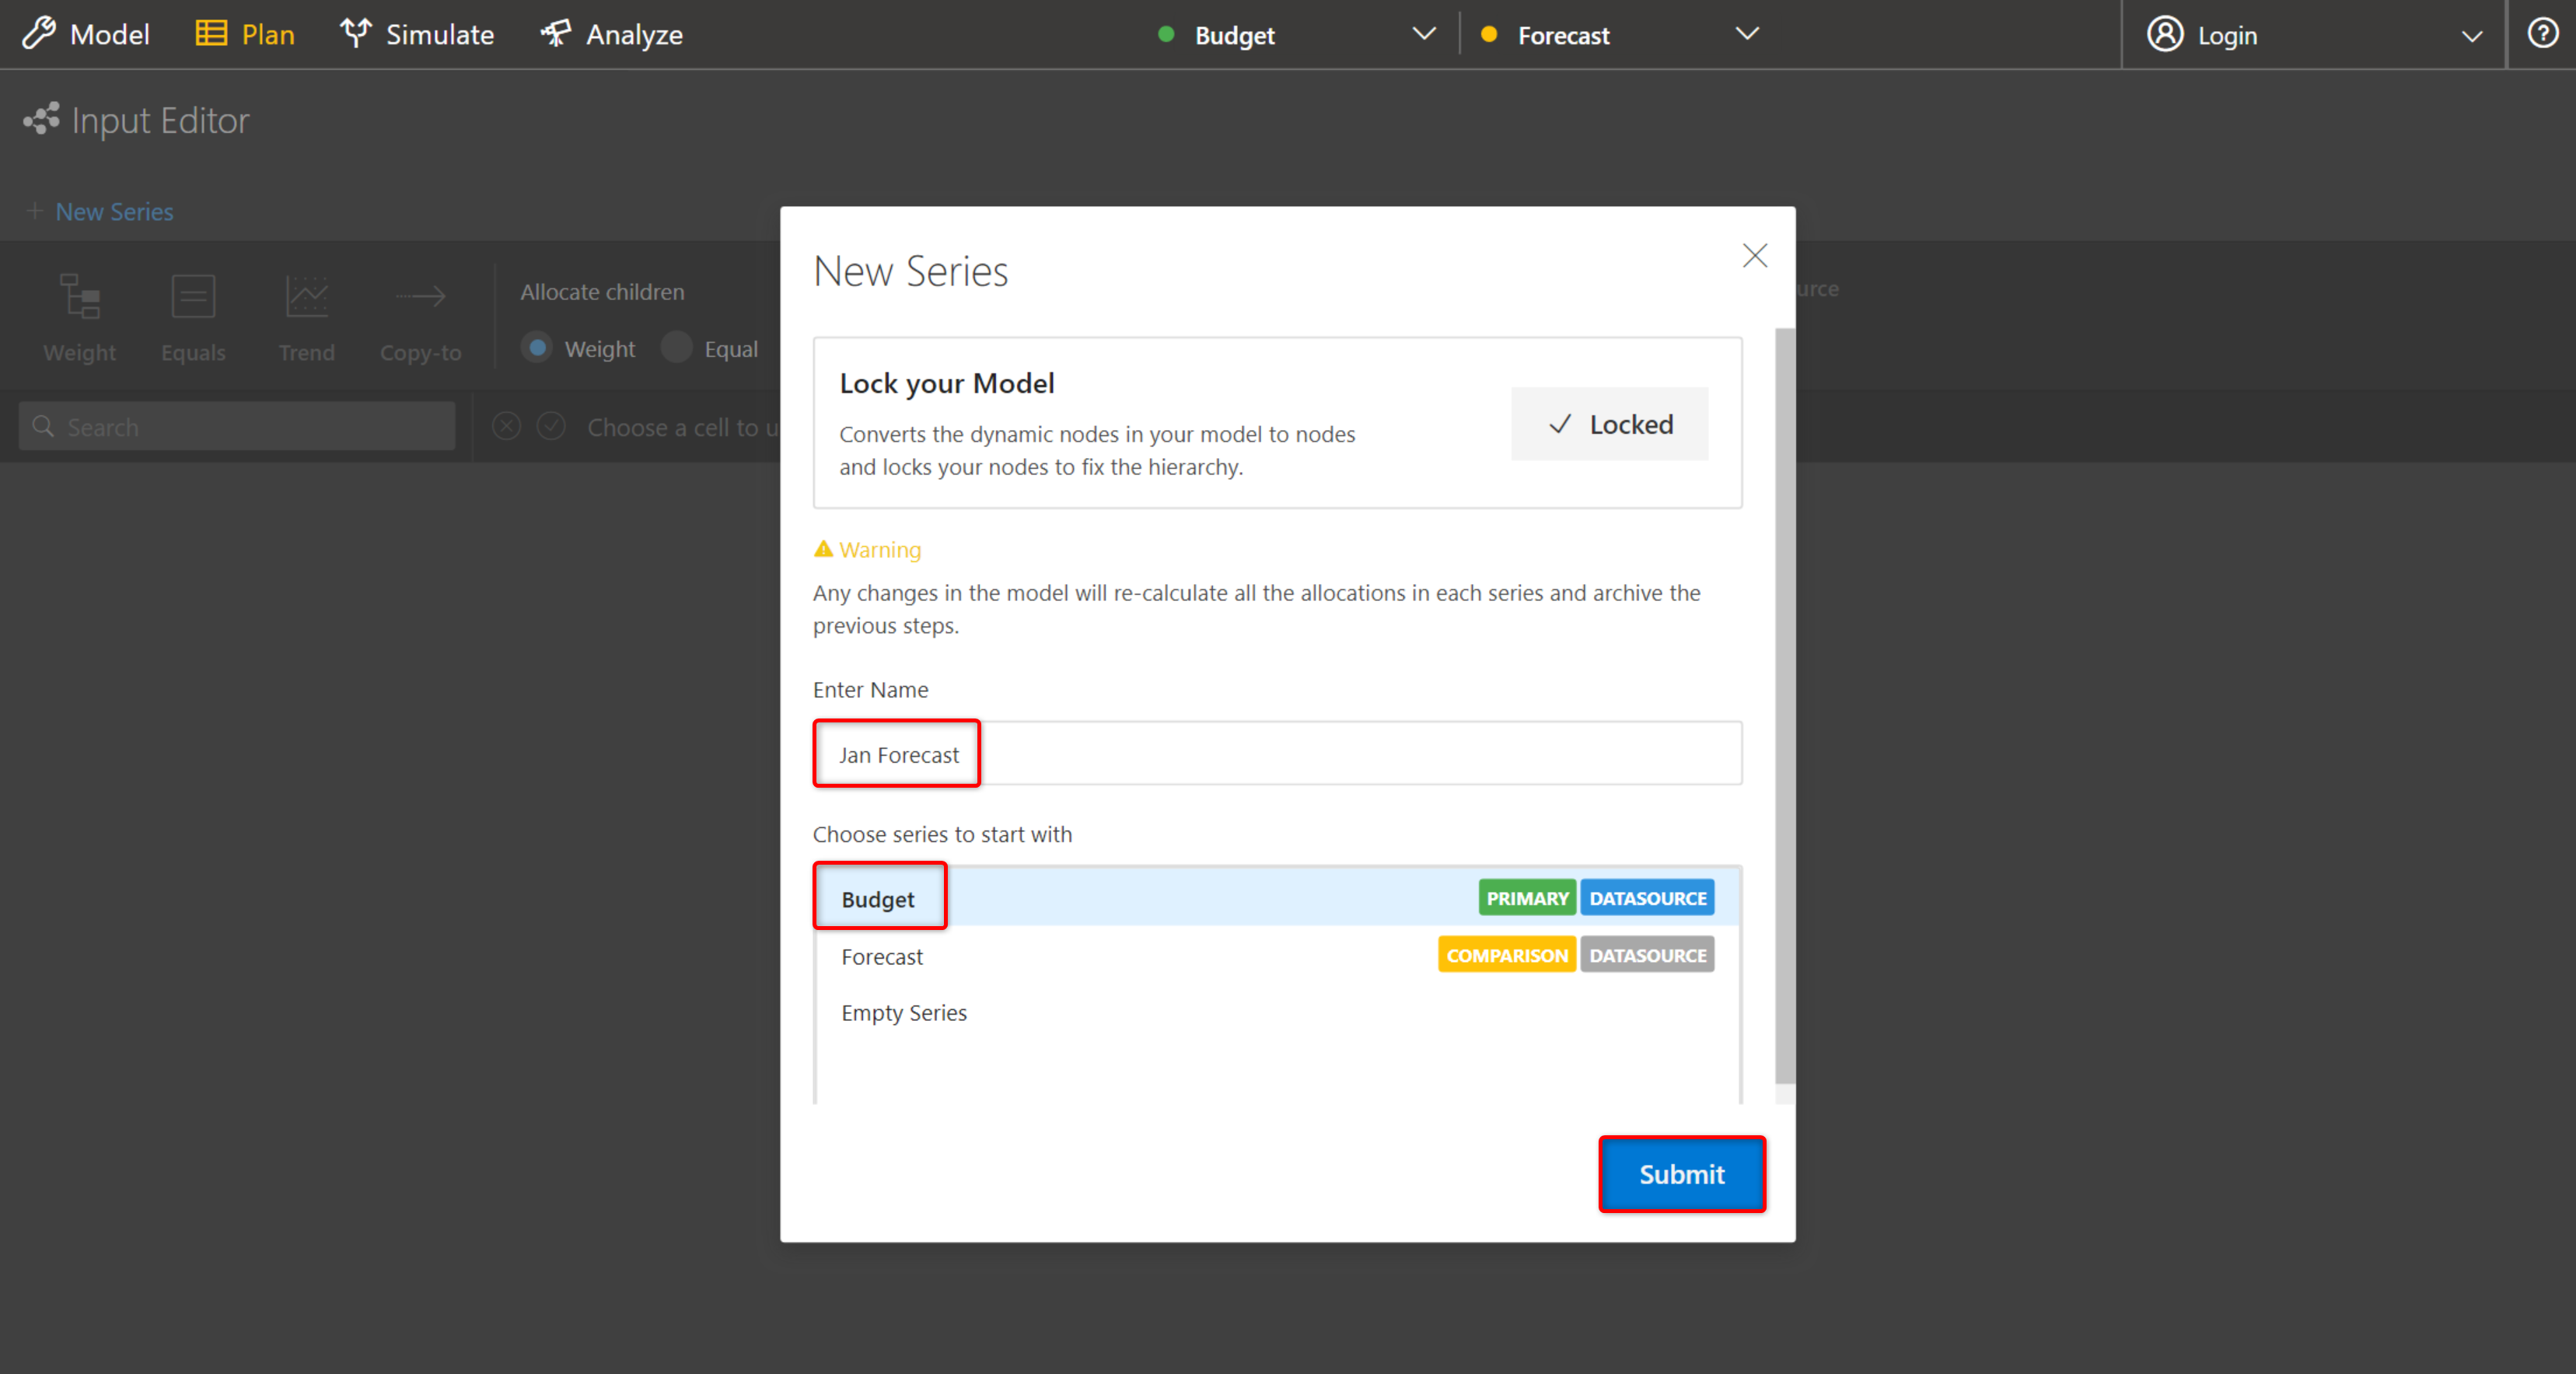
Once locked, the new series can be renamed and the base series can be chosen. The new series can be created based on ‘Budget’, ‘Forecast’ or from scratch by selecting ‘Empty Series’ option. In the figure below, the series has been named ‘Jan Forecast’ and ‘Budget’ has been selected as the series to start with.
Creating a new series
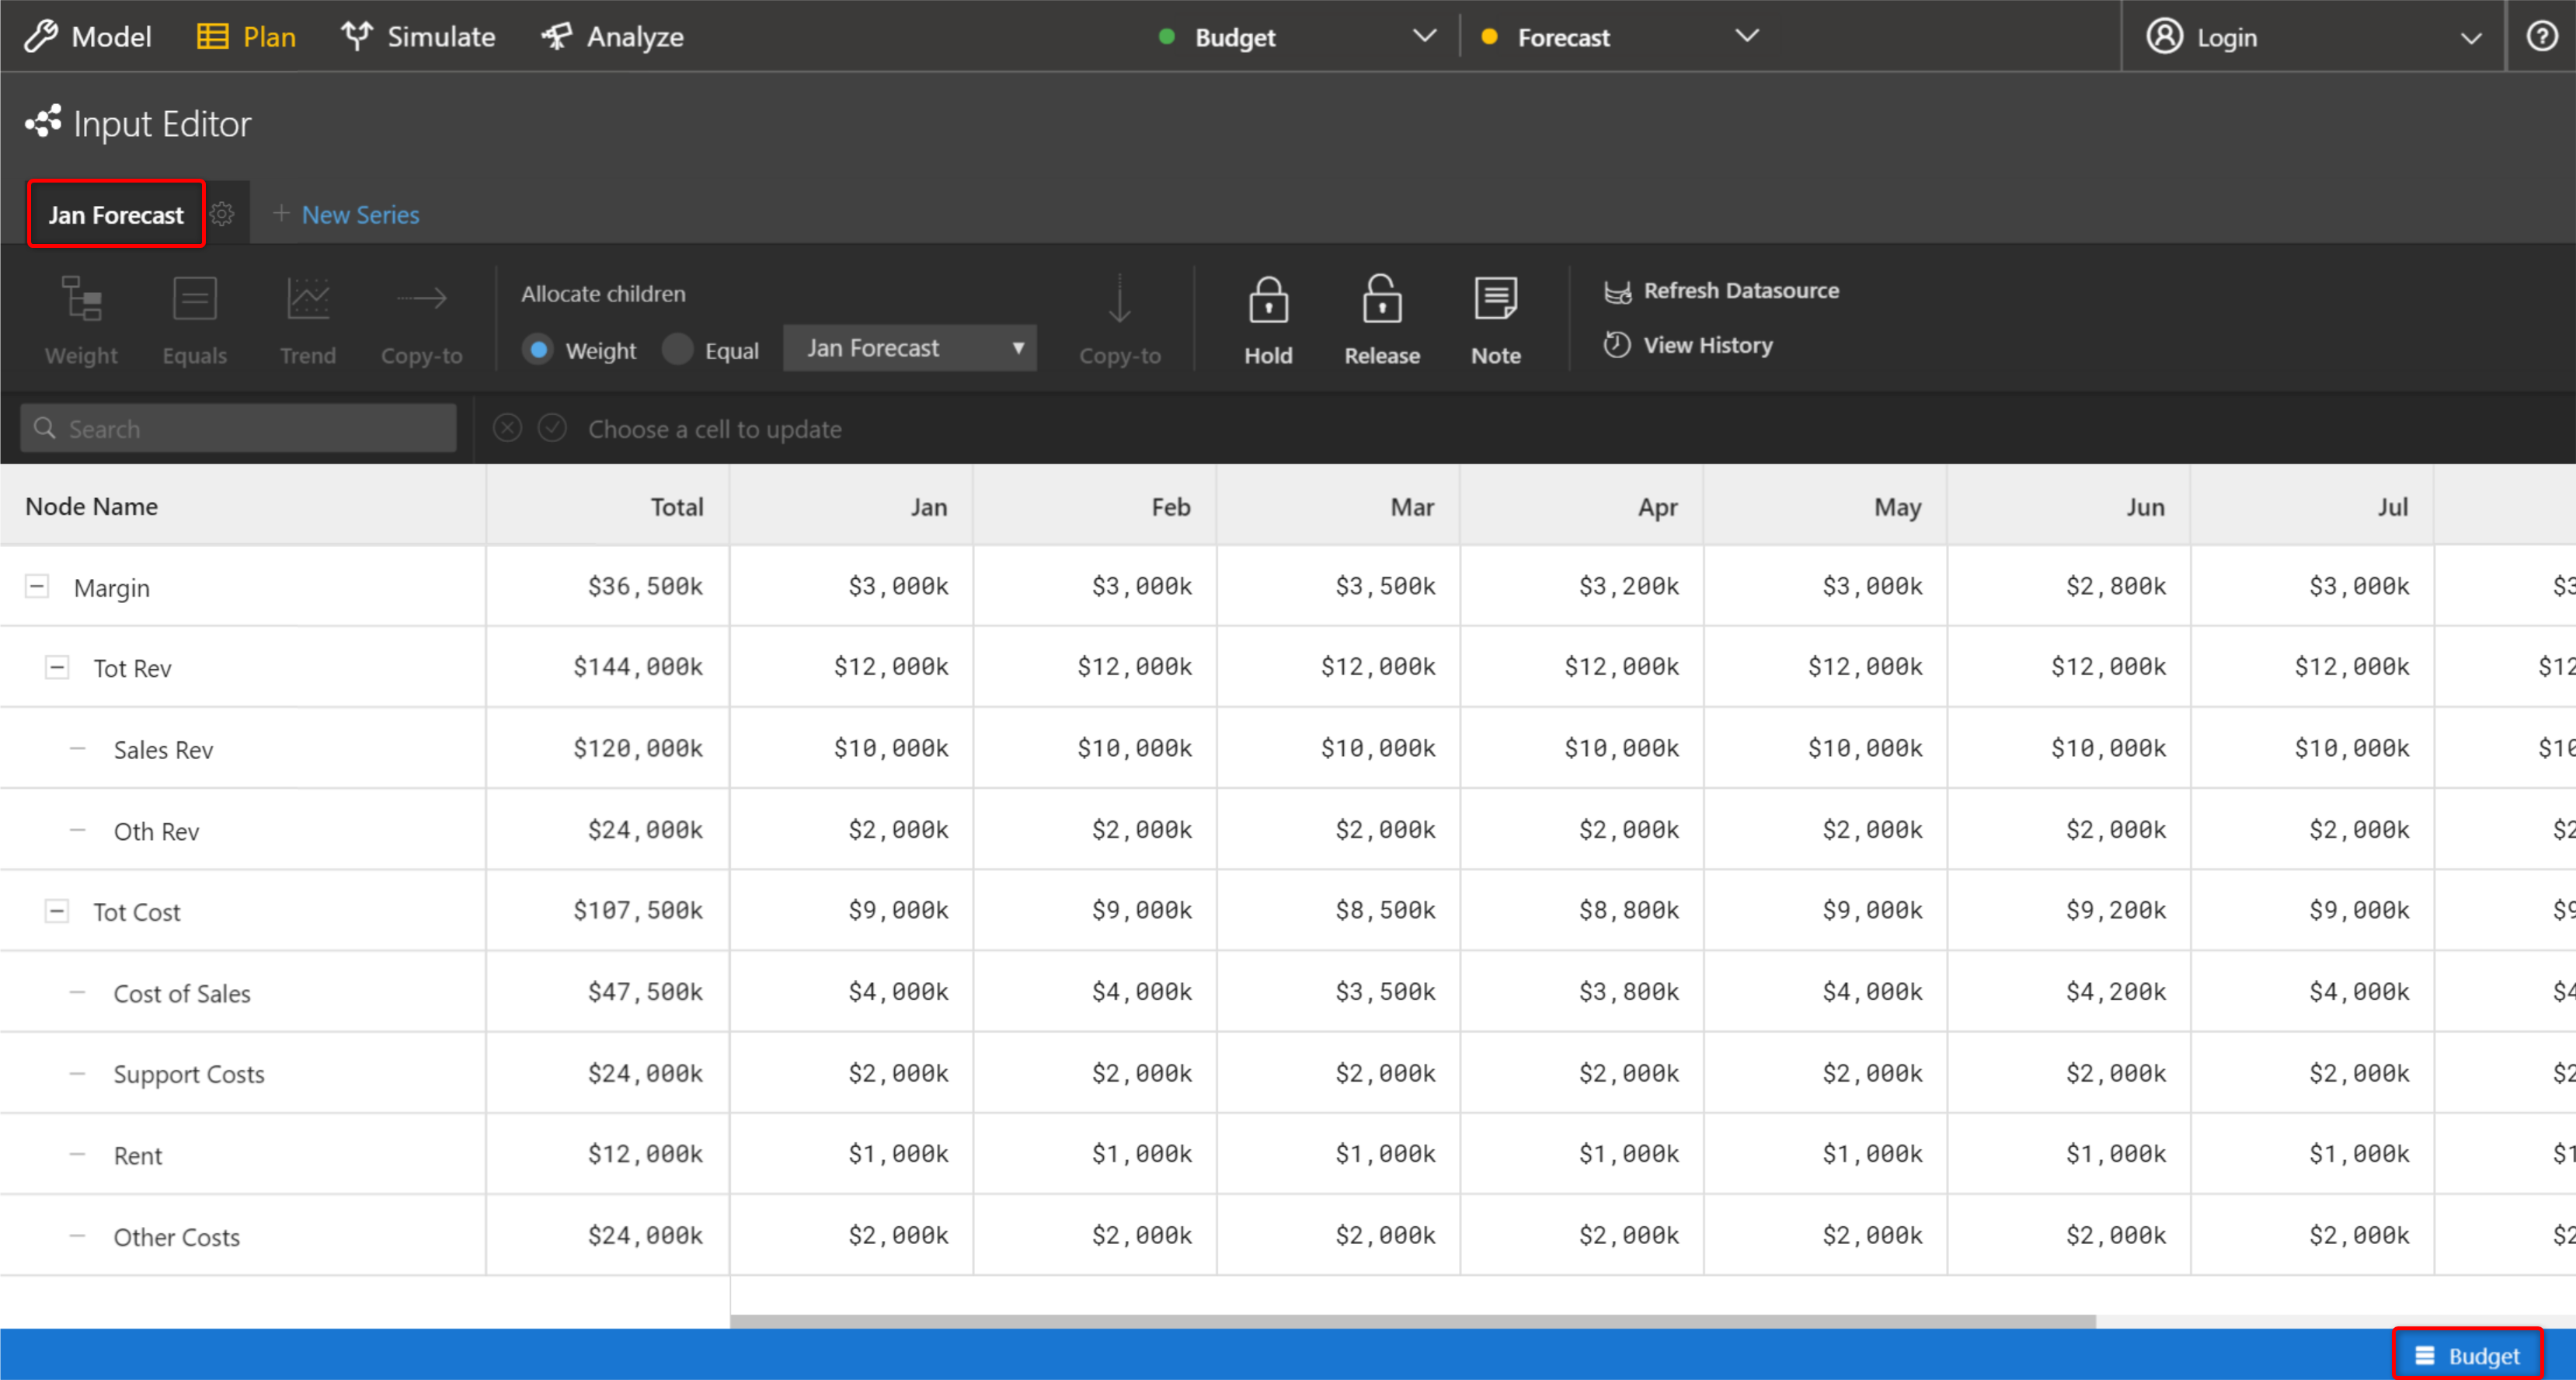
On clicking ‘Submit’, the ‘Input Editor’ screen opens.
The name of the series gets highlighted as shown in the figure below. The footer highlights the base series from which the particular series has been created.
Input Editor screen
The newly created series can be set as the primary or the comparison series by clicking on the settings icon. The series can also be renamed or deleted by choosing the appropriate option.
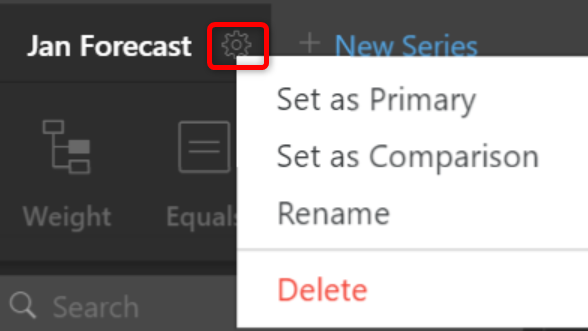
Context Menu
In the ‘Action Menu’, options to allocate values, add notes, refresh datasource and view history are present.
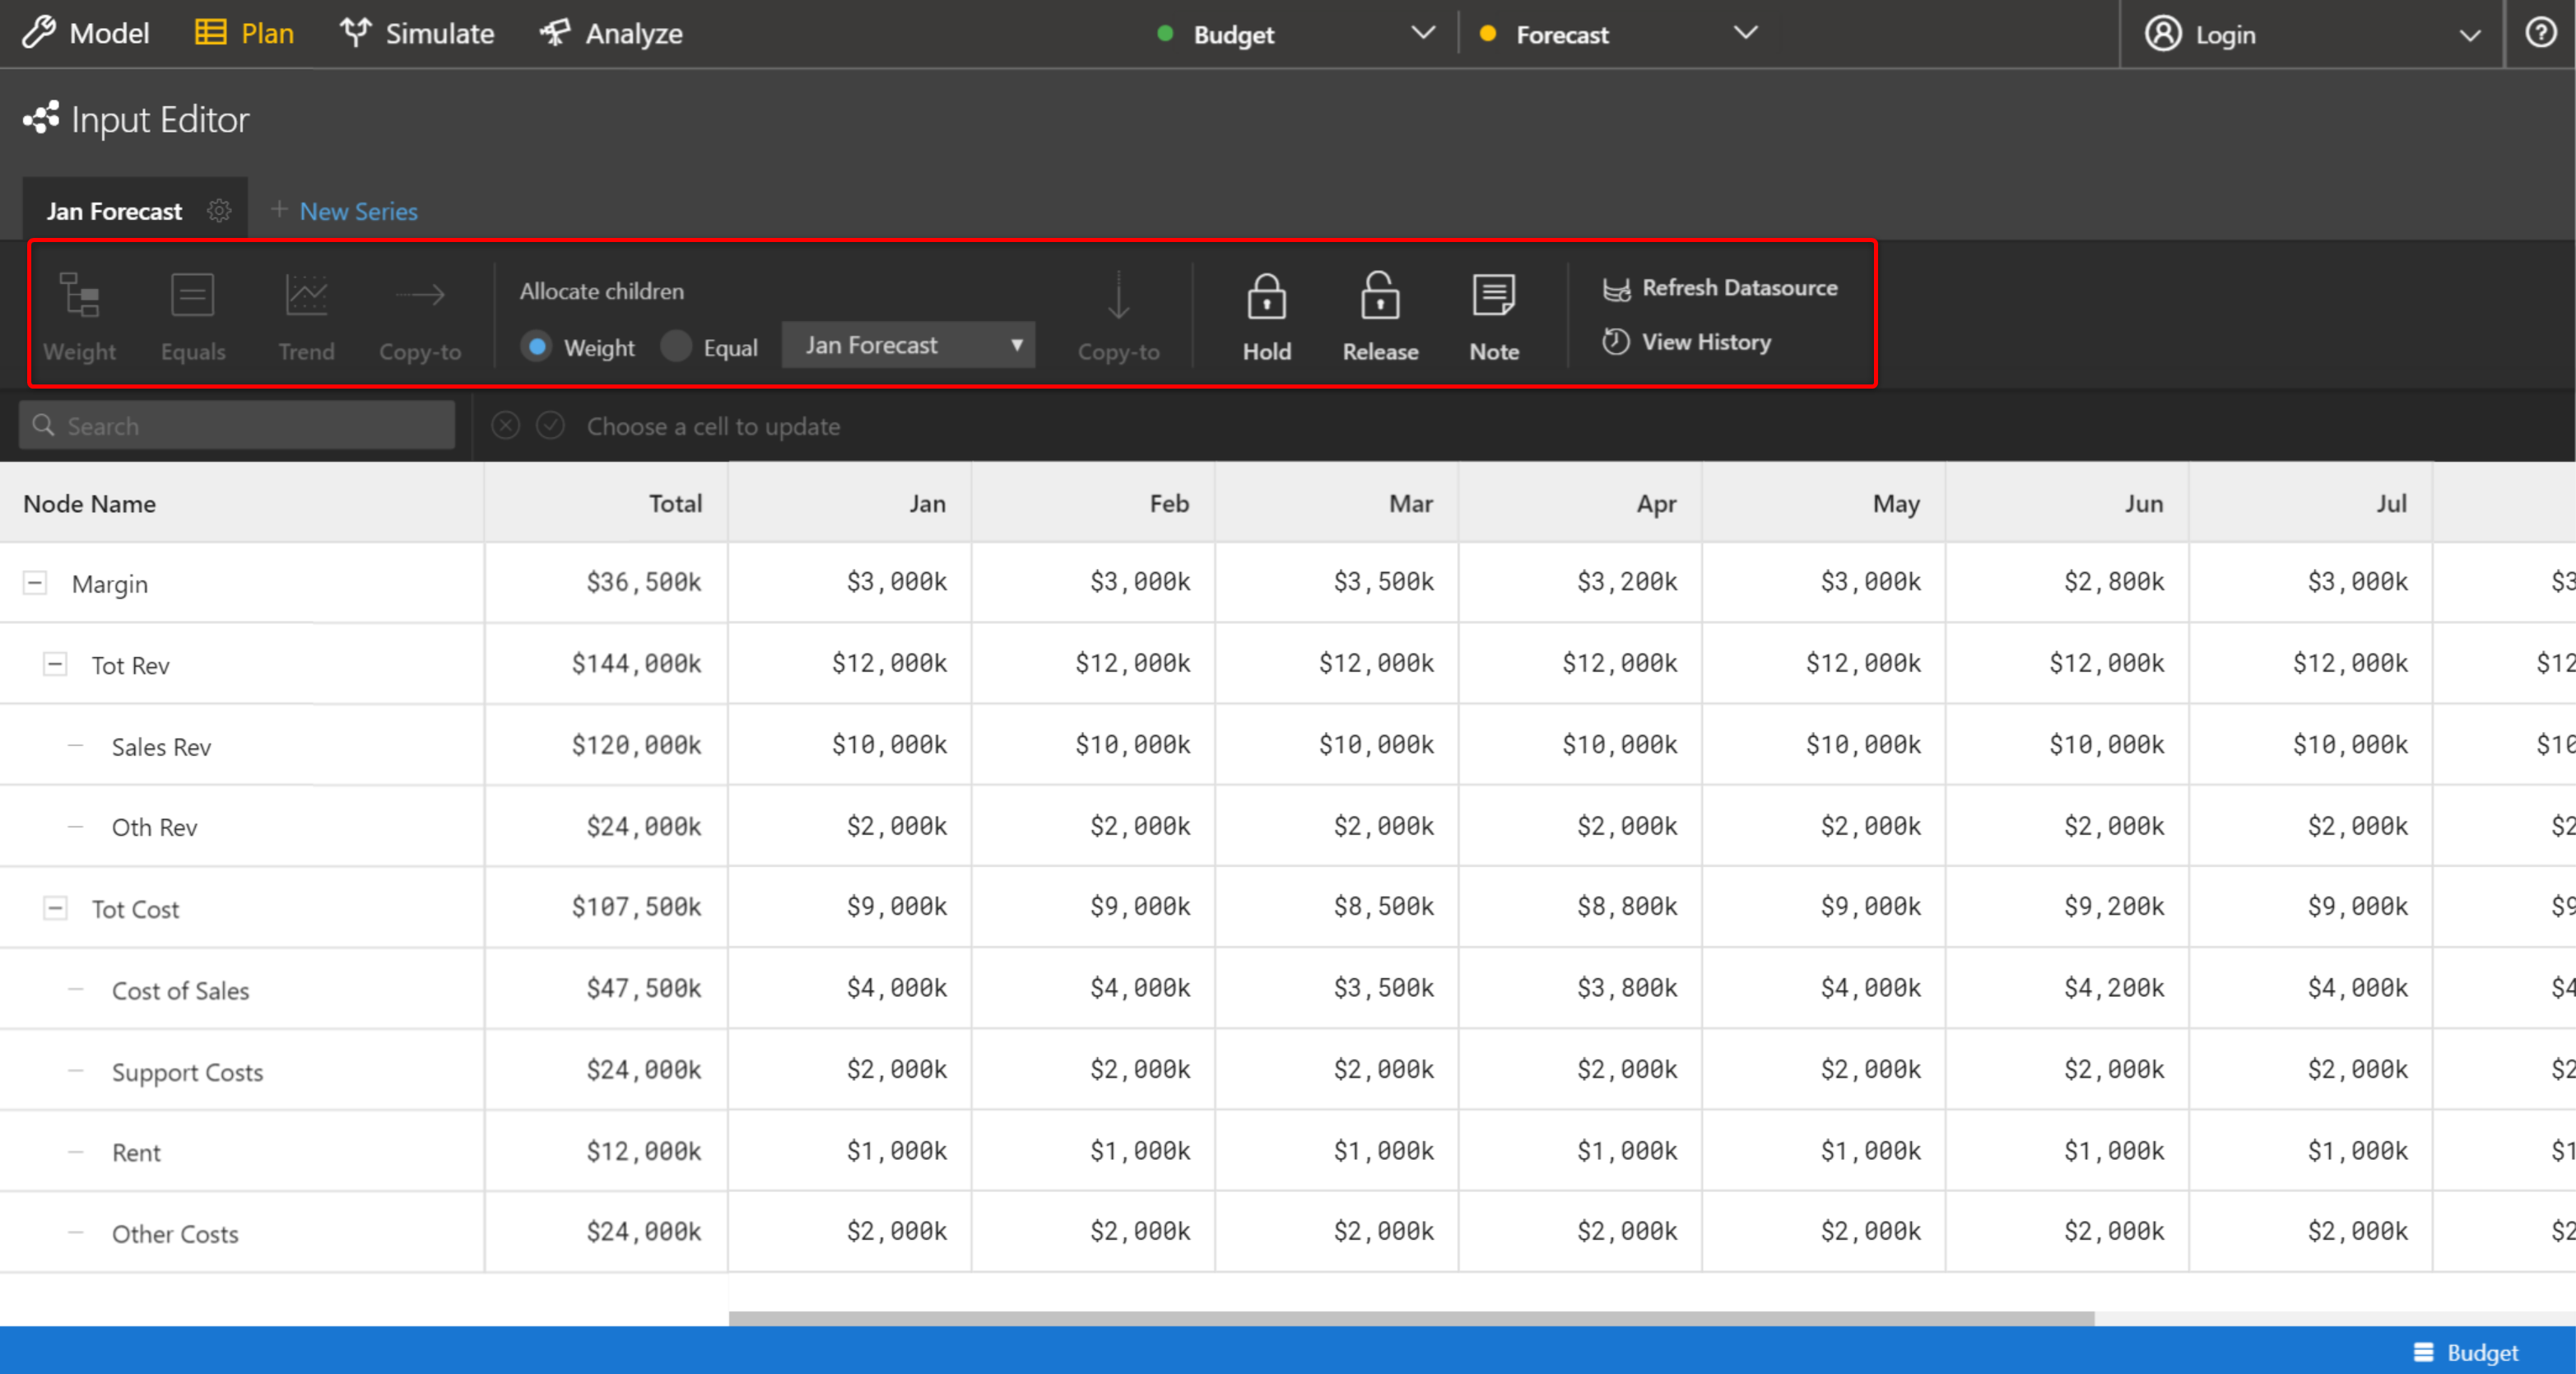
Action Menu
‘Weight’ and ‘Equals’ options can be used to allocate a node’s ‘Total’ value across all periods
‘Trend’ and ‘Copy-to’ options can be used to edit period values
Child nodes can be allocated either by weight or equally by choosing the ‘Weight’ or ‘Equal’ option in the ‘Allocate children’ section. ‘Copy-to’ can be used to copy a node’s value to its sibling nodes.
‘Hold’ and ‘Release’ can be used to lock or unlock certain cells as needed.
‘Note’ option lets the user to add, modify or delete notes.
On clicking ‘Refresh Datasource’, the newly created series gets updated if there are any changes to the input data.
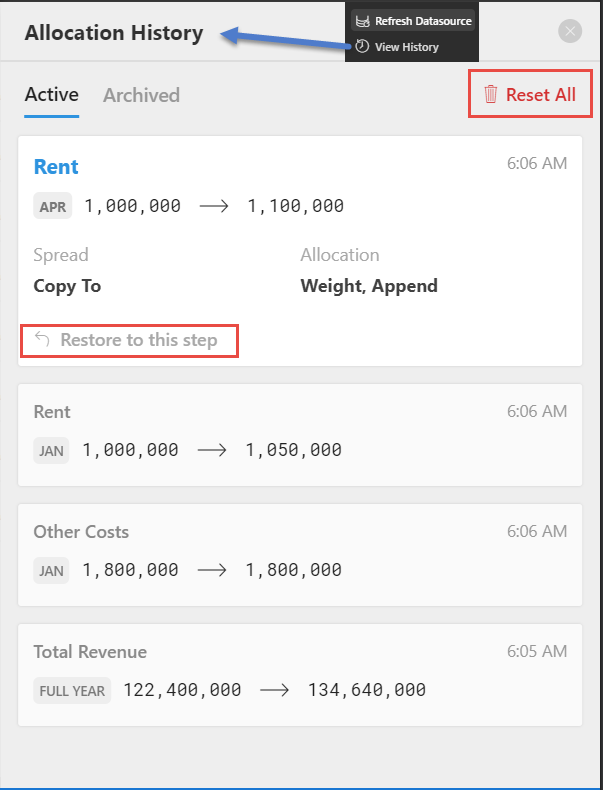
‘View History’ can be used to view the changes performed and also roll back changes.
There is a ‘Search’ option which is particularly useful when using large models. On entering a node name or node ID, only the corresponding node and its child nodes get displayed.
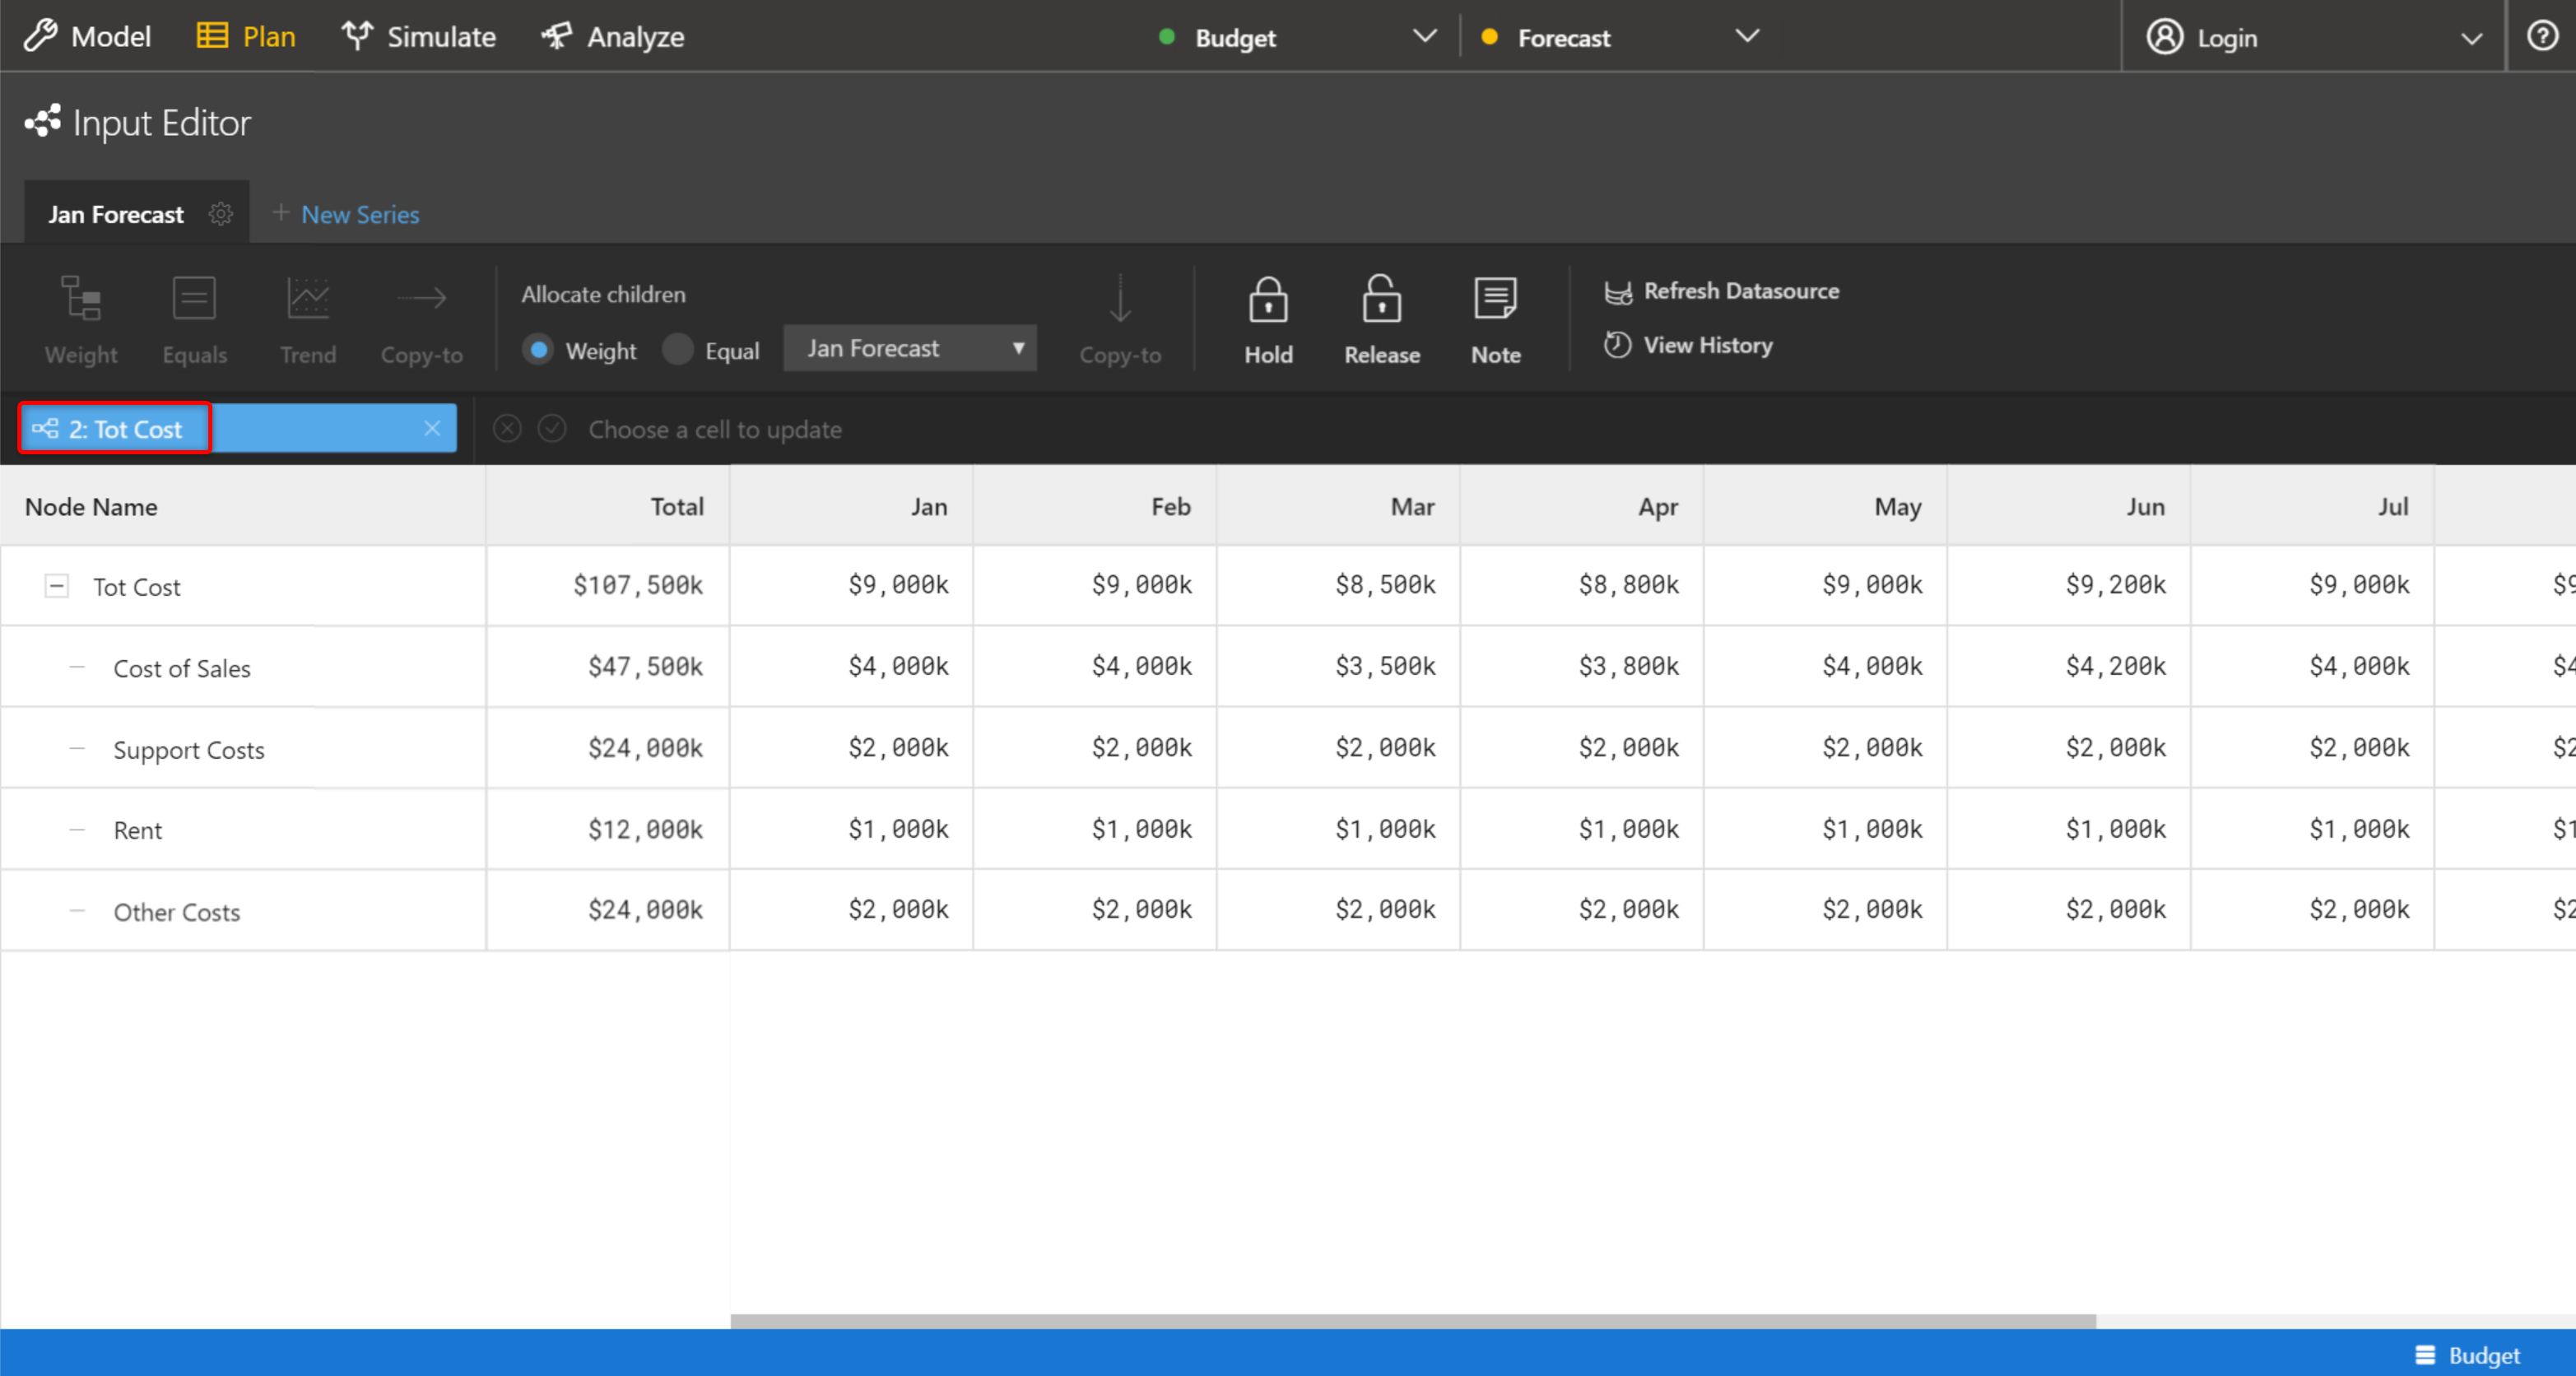
Search option for filtering nodes
The model along with the overall and period values get displayed in a table form. In case, the empty series has been chosen as the series to start with, only the structure and relationships are displayed and not the values.
On selecting a cell, additional information such as the calculation method and time aggregation for the node appears in the footer. The number format and scaling that were configured while modelling are retained. The ‘Number Bar’ will have the absolute value irrespective of the format and scaling.
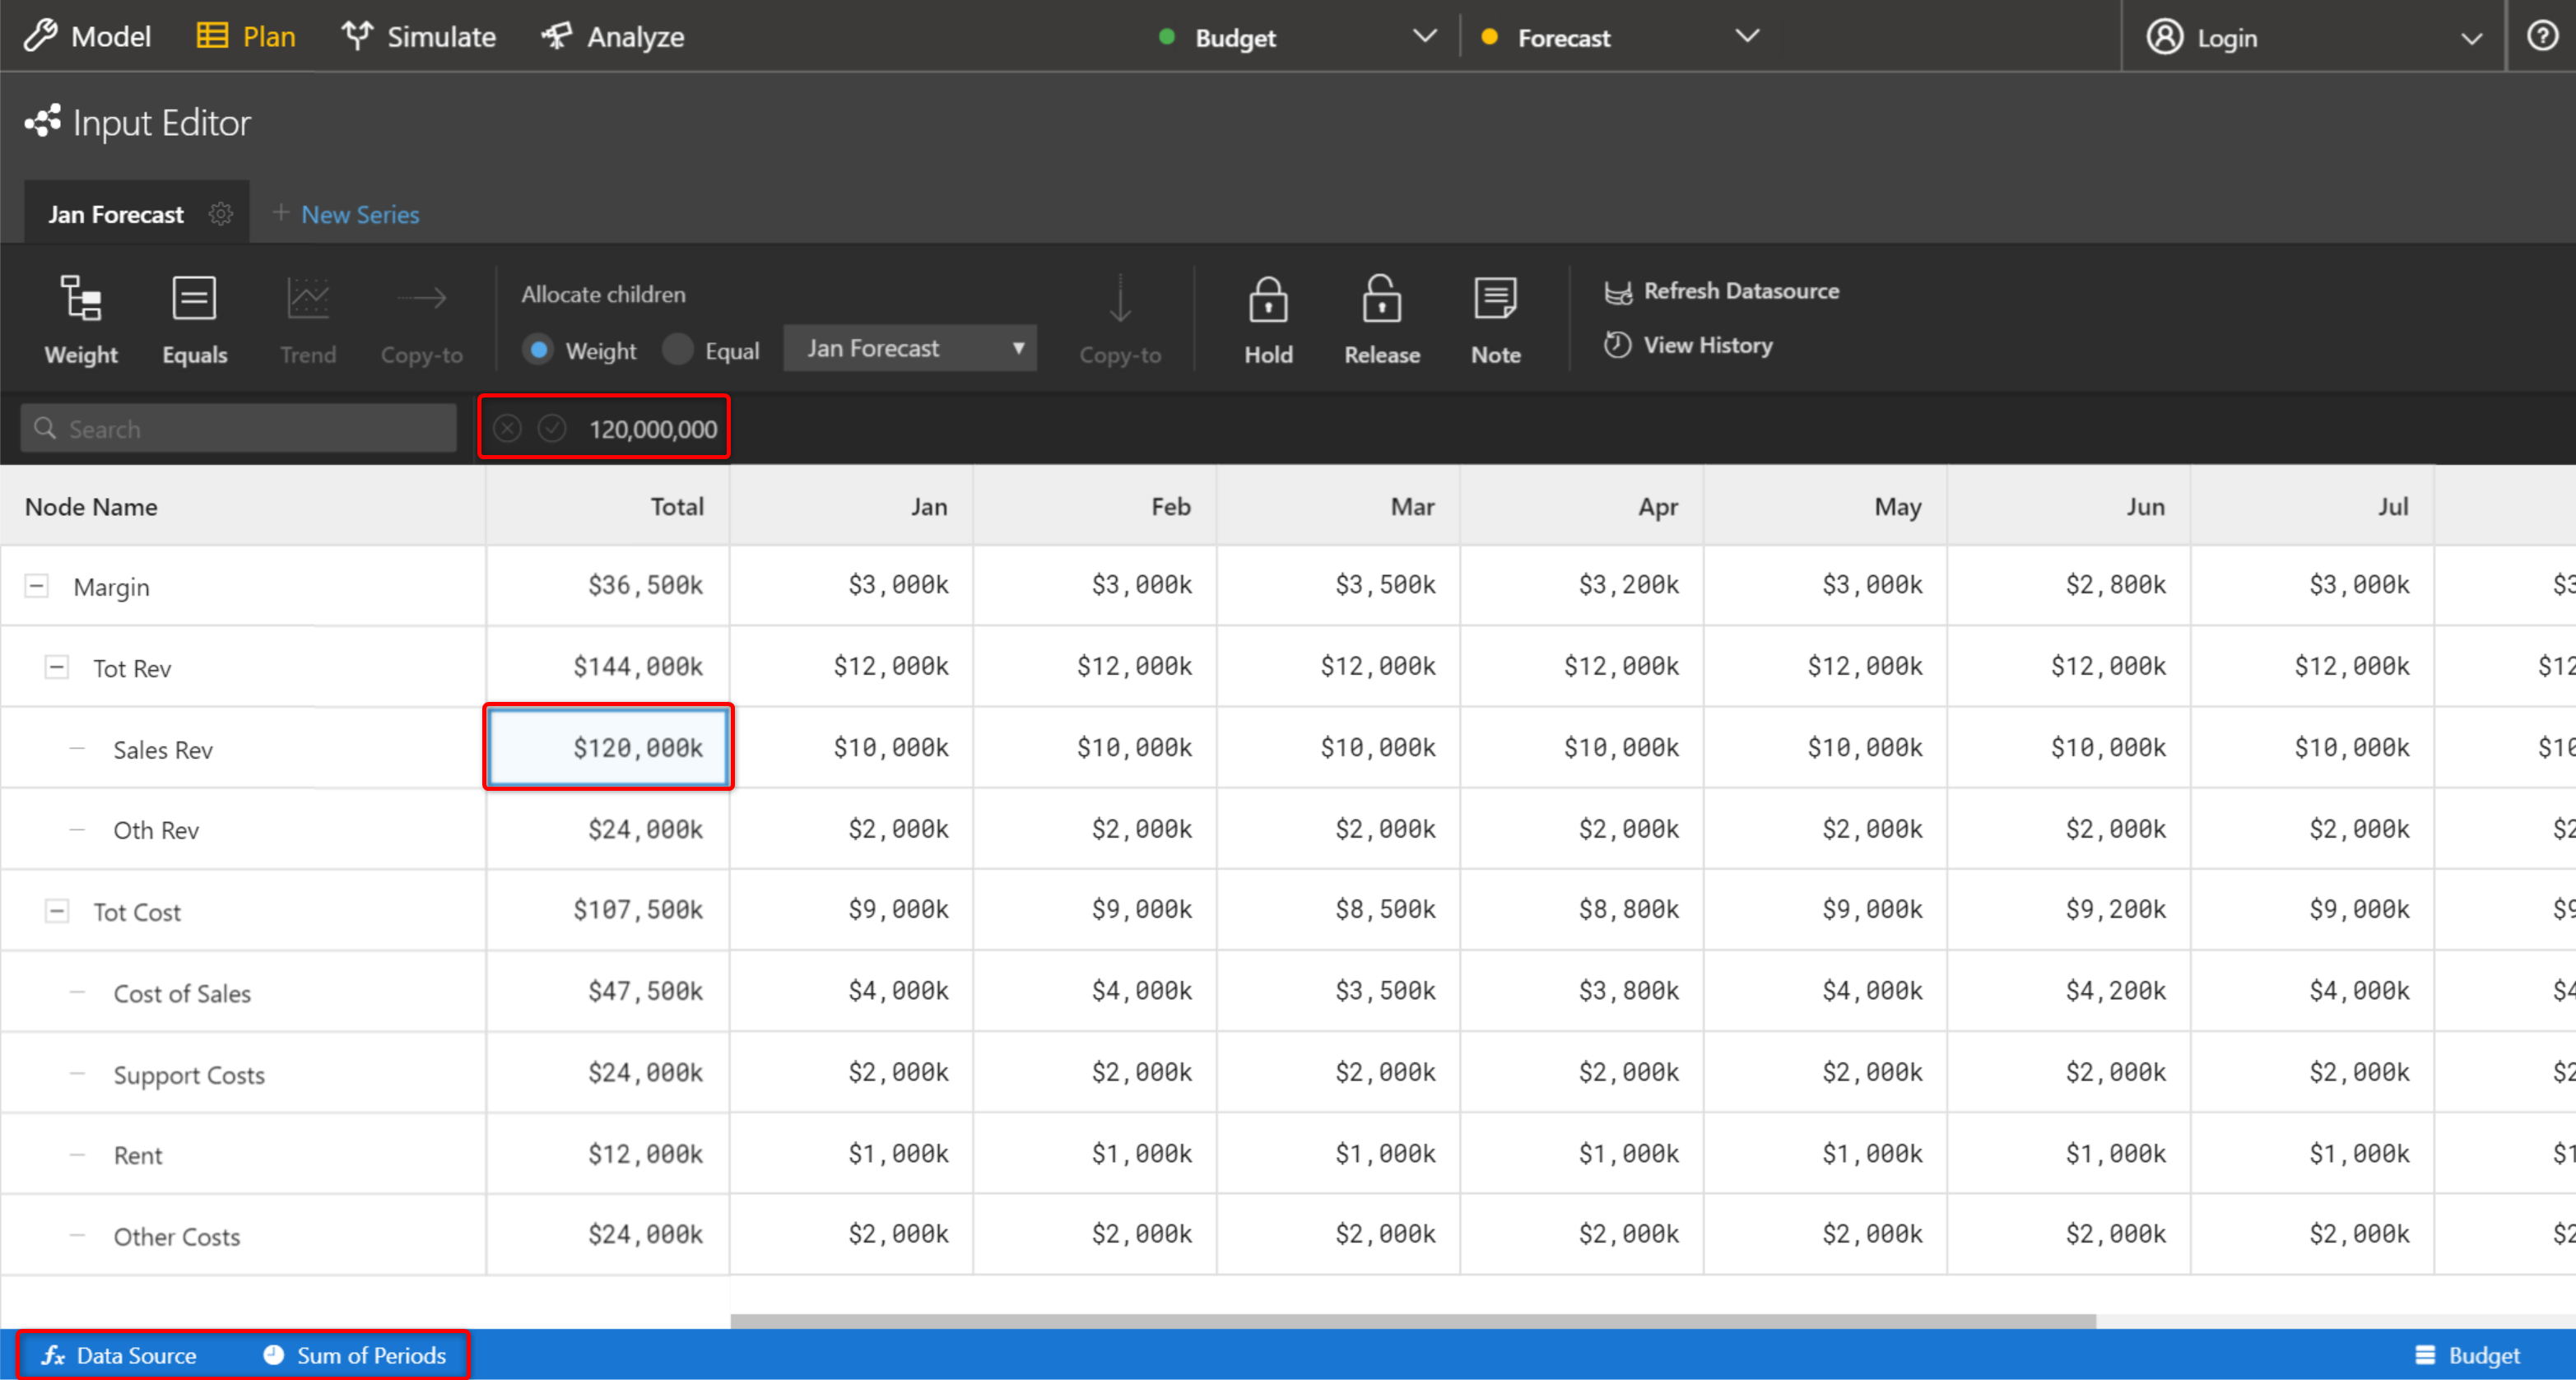
Table view
Budgeting & allocation scenarios
Scenario 1: To increase Total Revenue by 10% and allocate the increase to Sales Revenue with no changes to Other Revenue
For our example, expand the Total Revenue. Now select the node ‘Other Revenue’ and lock the node (see Figure below).
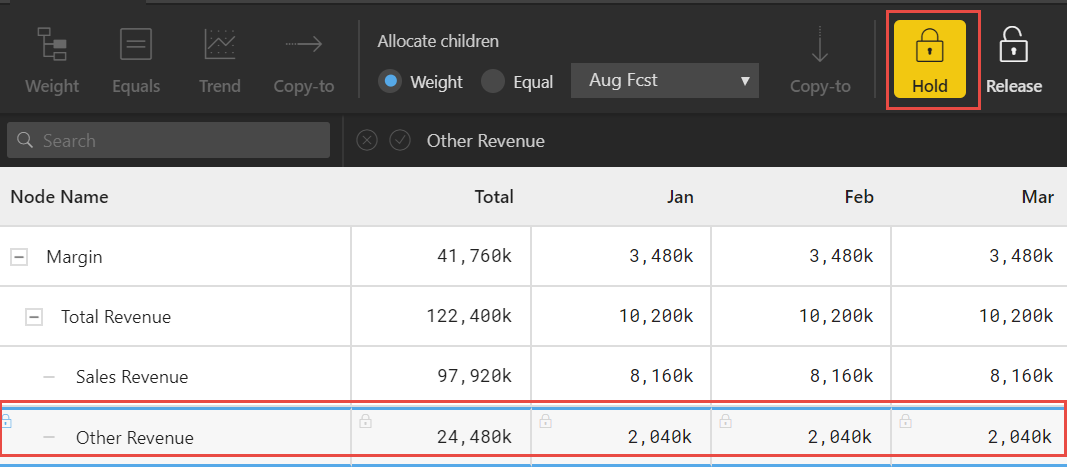
Locking node
Now select the Total Cell for node ‘Total Revenue’ as shown in the below Figure.
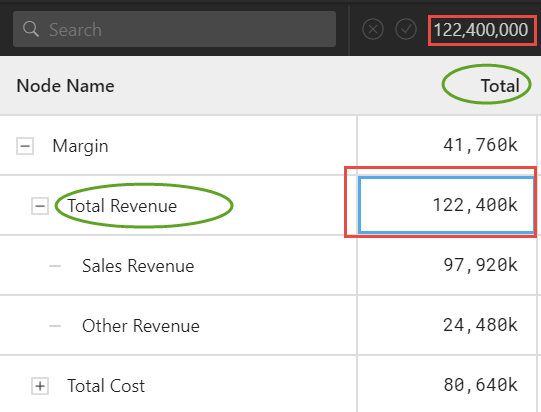
Cell selection
You can update the number by double clicking the cell and entering the number directly in the number bar. Or you can enter the number in the popup.
Now double click the total cell and type ‘+10%’ at the end of the number and click on ‘Weight’ as shown in the below Figure.
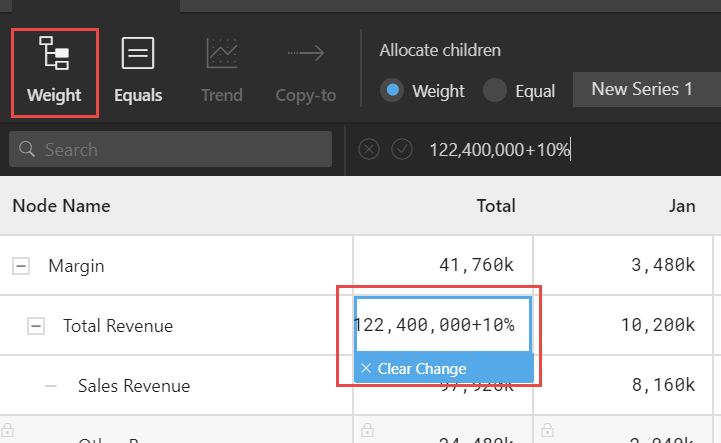
Total cell value increased to 10 %
You will be able to view the ‘Spread by Weights’ screen.
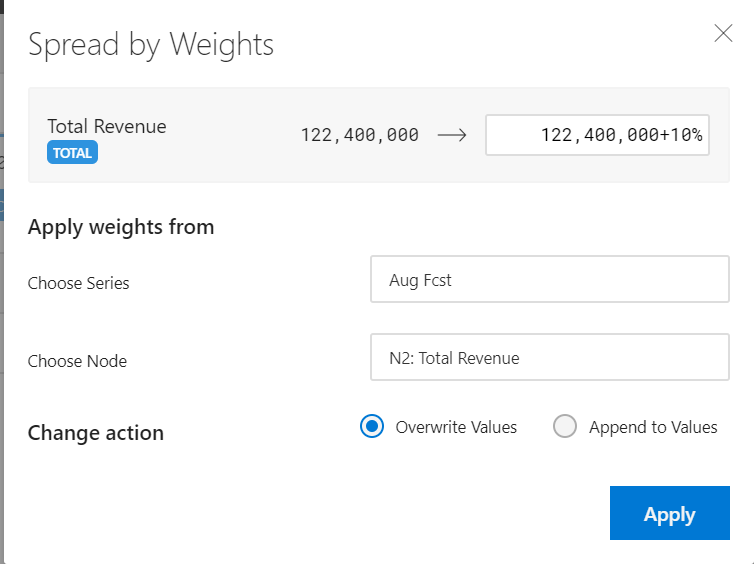
Spread by Weights
By default, the current node and the current series are selected. You can also select different weights to allocate. You can further decide to allocate the full amount or the delta amount (see Figure above).
The ‘Overwrite Values’ option deletes the existing period values and rewrites the new allocated value. The ‘Append to Values’ option will add the delta value to the existing period values and only the delta value gets allocated based on the selected weights (see Figure above). For our example, the Overwrite option has been selected.
As an end result of the Scenario 1, you will be able to view the Input Editor screen updated with the configured values (see Figure below). The cells which were impacted because of the allocation operations turns yellow.
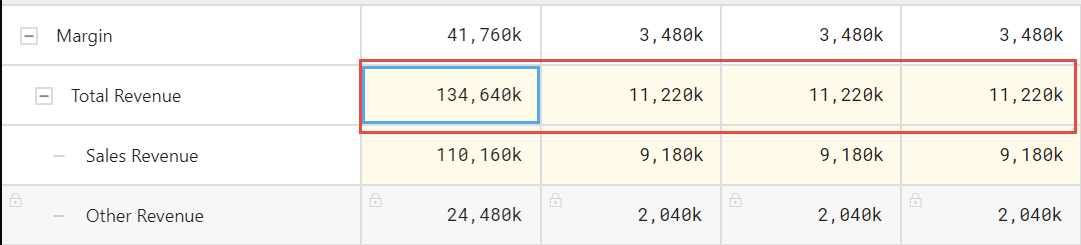
Increased ‘Total Revenue’ without impacting ‘Other Revenue’
Scenario 2: To increase ‘Cost of Sales’ by 10% from April onwards
For our example, select the Node ‘Cost of Sales’ for April month (see Figure below).
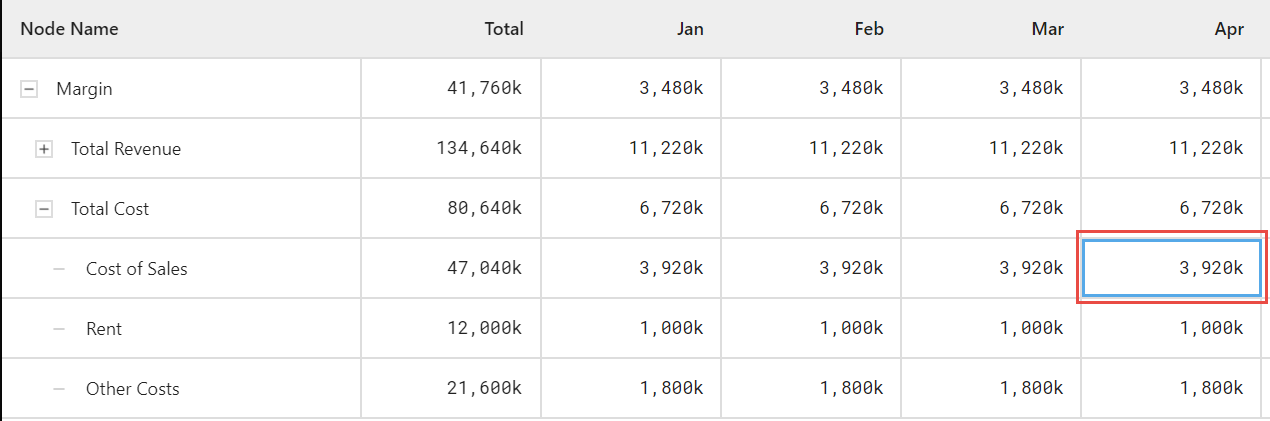
Cell Selection
Increase the cell value by 10% and click Enter (see Figure below).
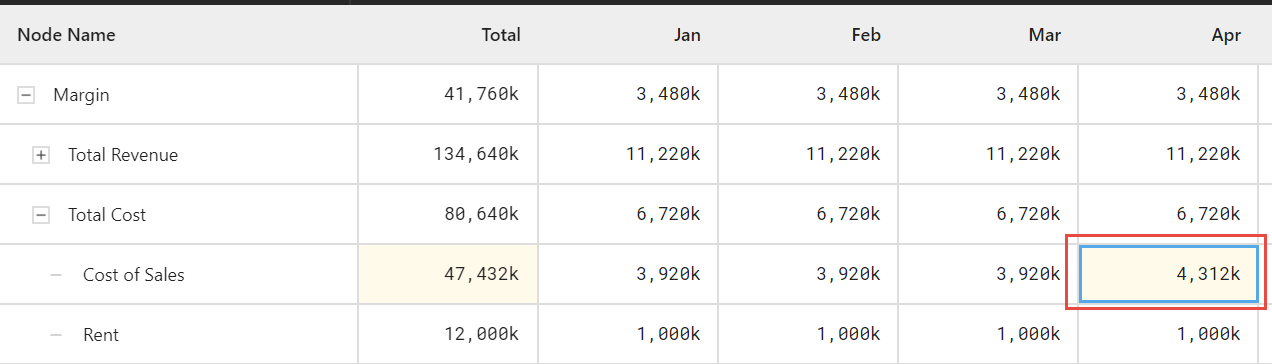
Cost of Sales for April increased by 10%
Now click the “Copy To” icon to copy the value from April across the periods till December (see Figure below)
Copy-to icon
After clicking the Copy to icon, the Input Editor screen looks similar to the Figure shown below.
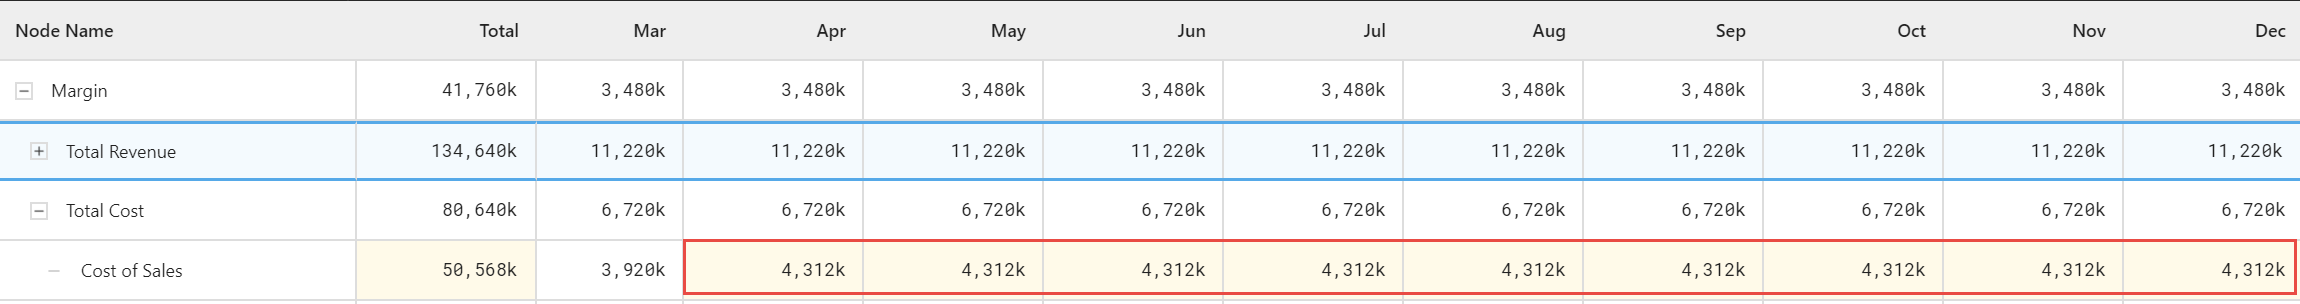
Constant cell values from Apr to Dec
Scenario 3: To increase ‘Other Costs’ based on a monthly trend of 2%
For our example, select the Node ‘Other Costs’ for Jan month (see Figure below).
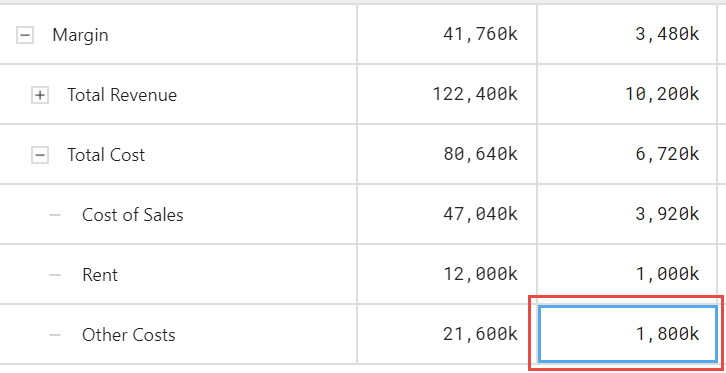
Cell Selection
Now click the ‘Trend’ icon (see Figure below)
Trend icon
Now the Trend pop up opens. For our example, select the ‘By Percentage’ option and enter value 2 in the Increase Trend section. Now select the Overwrite Values option and click ‘Apply’ (see Figure below).
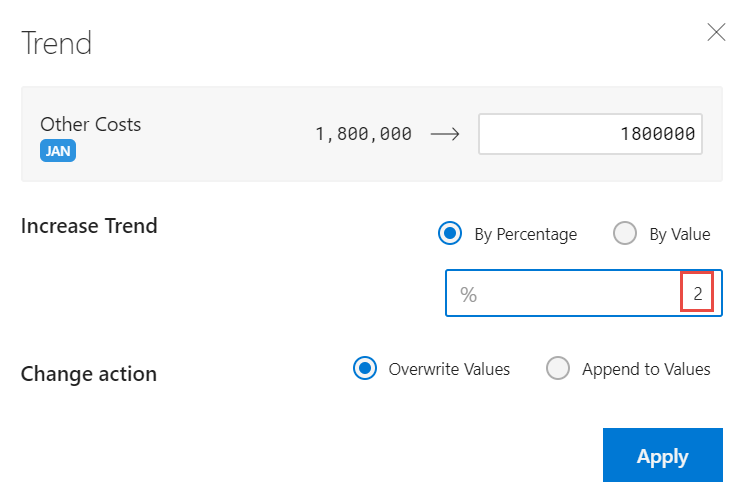
Increasing Trend of 2 %
Based on the above configuration, you will be able to view the Input Editor screen as shown below.

Increased monthly trend
Scenario 4: To redistribute ‘Support Costs’ based on ‘Cost of Sales’.
For our example, select the Node ‘Support Costs’ in Total column (see Figure below).
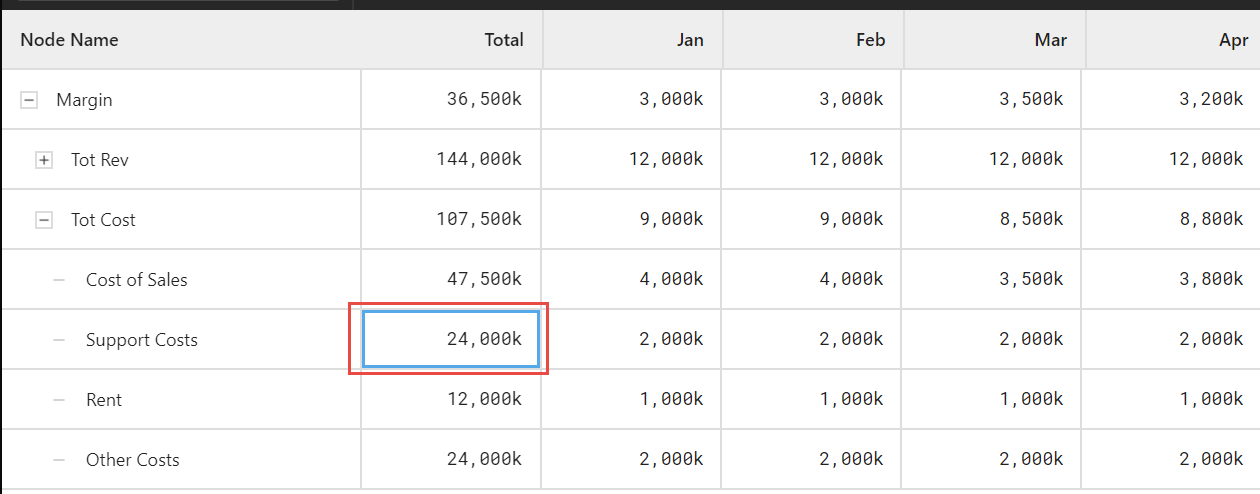
Cell Selection
Now click the ‘Weight’ icon (see Figure below)

Weight icon
The Spread by Weight pop up opens. For our example, select the Node as ‘Cost of Sales’. Select the ‘Overwrite Values’ option and click ‘Apply’ (see Figure below).
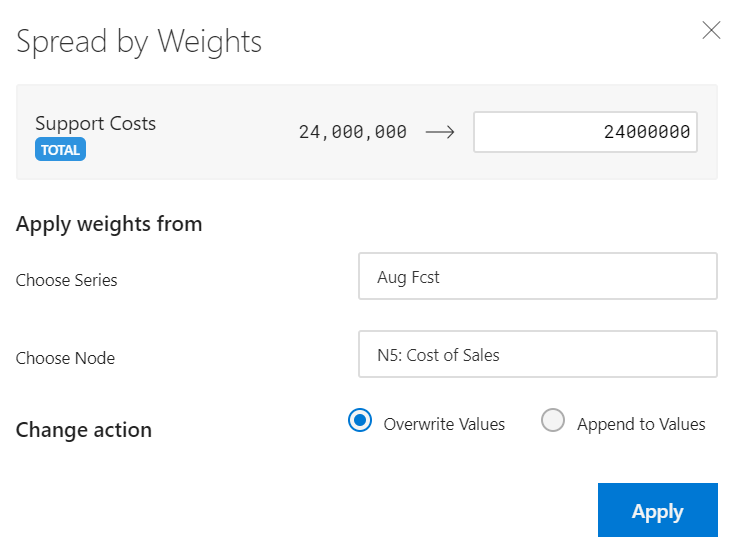
Spreads by Weights
As an end result of the Scenario 4, you will be able to view the Input Editor screen loaded with the redistributed values (see Figure below).
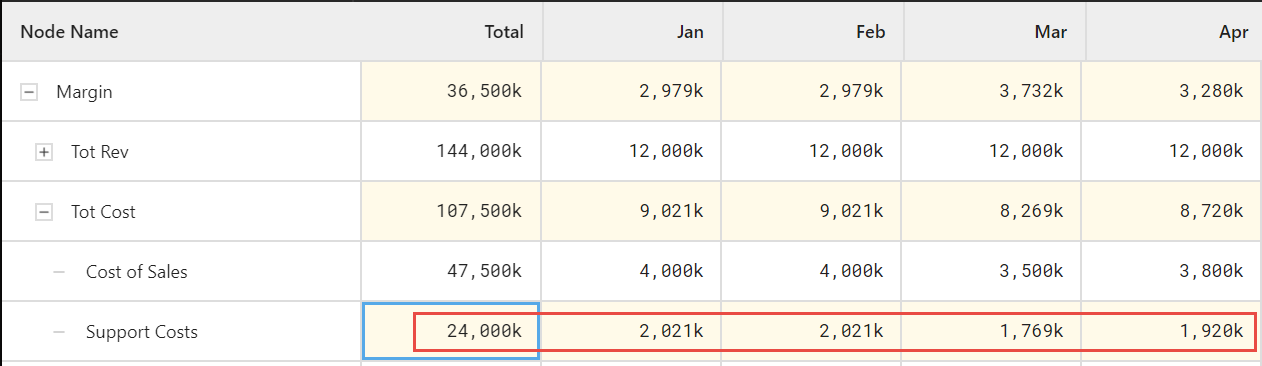
Redistributed values
Scenario 5: To increase ‘Rent’ by 5% for Q1 and 10% from Q2 Onwards.
Select the Node ‘Rent’ and lock the entire Row.
Release the lock for the cells from Jan to Mar.
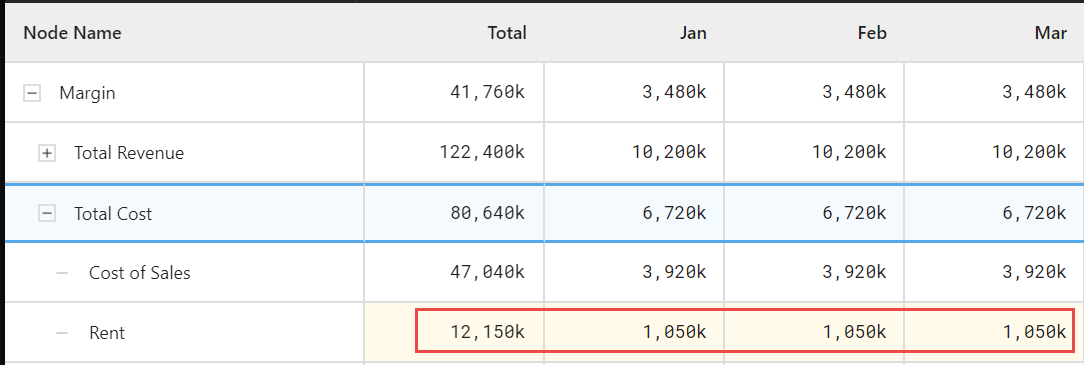
Now select the cell ‘Jan’. Increase the value by 5% (see Figure below).
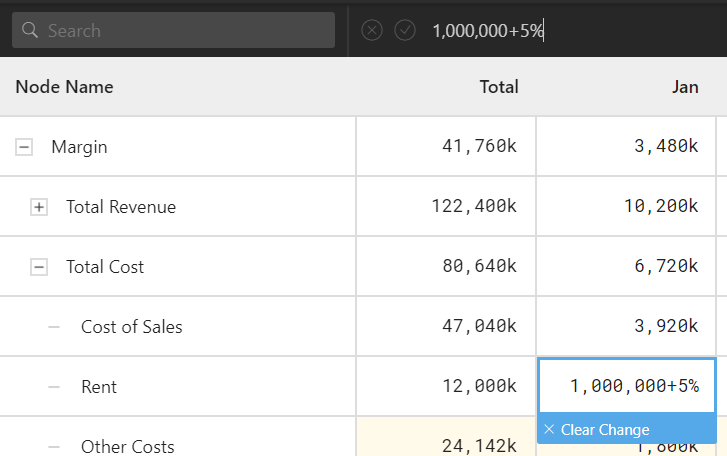
Rent increased by 5% for Jan Month
Now copy it across the cells. The Input Editor looks similar to the Figure as shown below.
Rent increased by 5% across the cells in the Row
Now release the lock for the complete Row of the Node Rent.
Select the cell ‘Apr’. Increase the value by 10% (see Figure below).
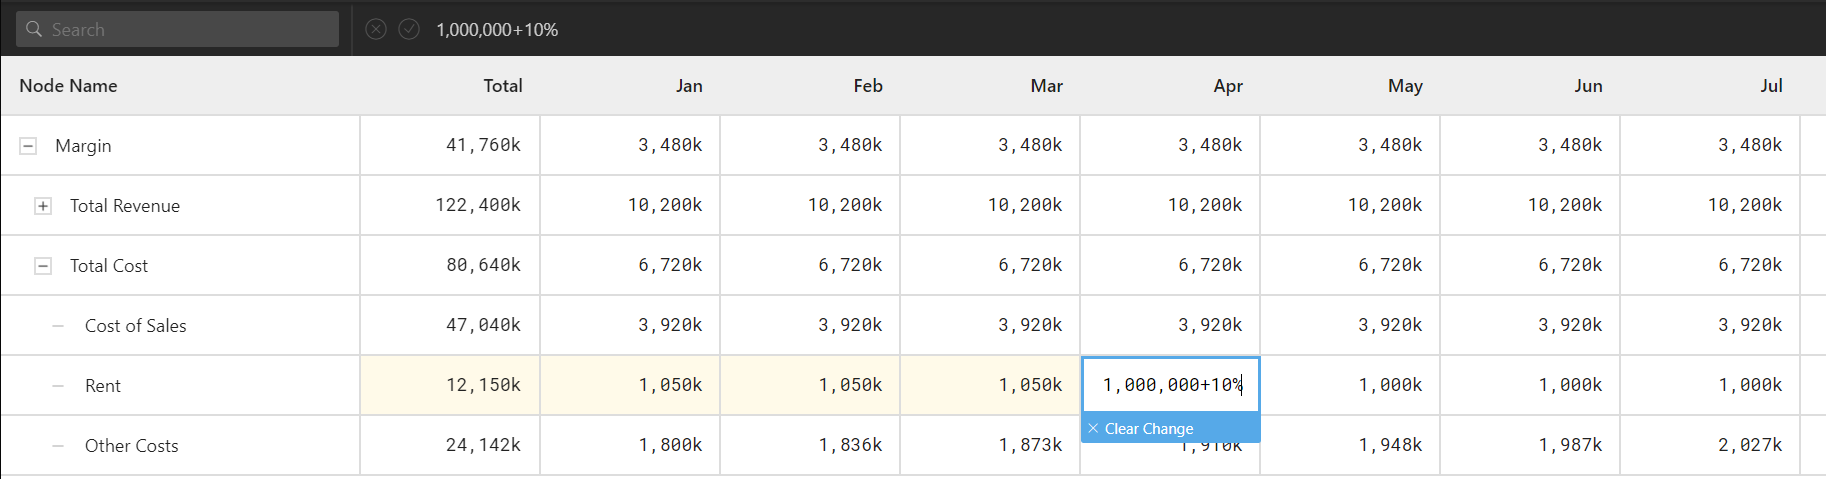
Rent increased by 10% for Apr Month
Now copy it across the cells. The Input Editor looks similar to the Figure as shown below.
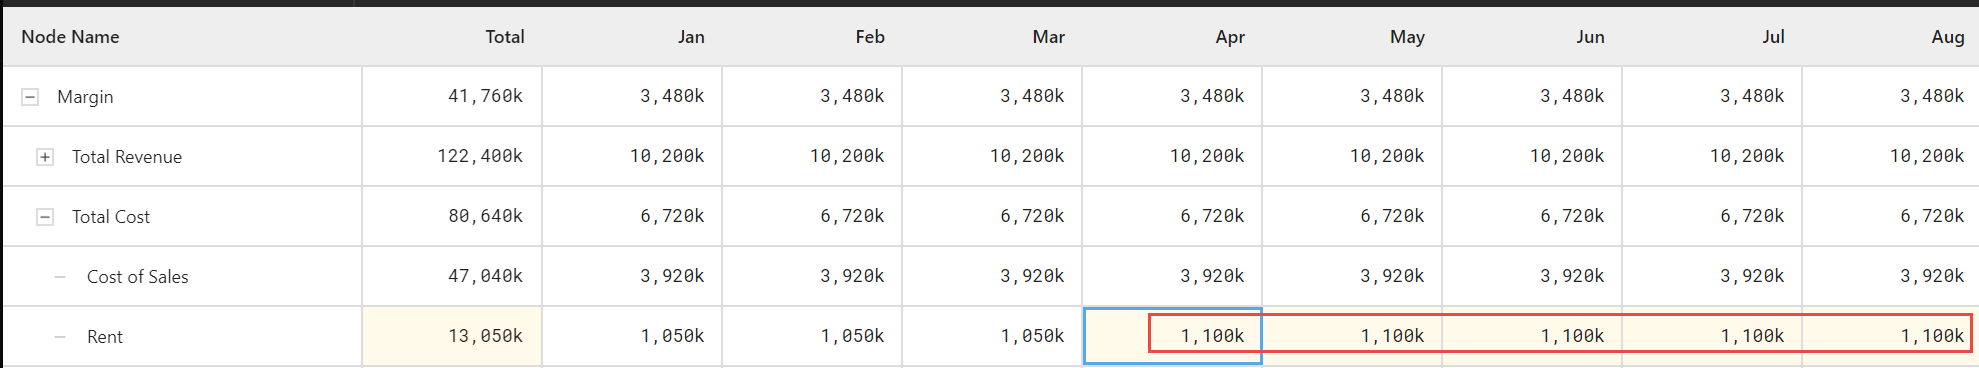
Rent increased by 10% from Apr till Dec
Other features
Adding a Note
In the Input Editor, select the node ‘Rent’ for Total column (see Figure below).
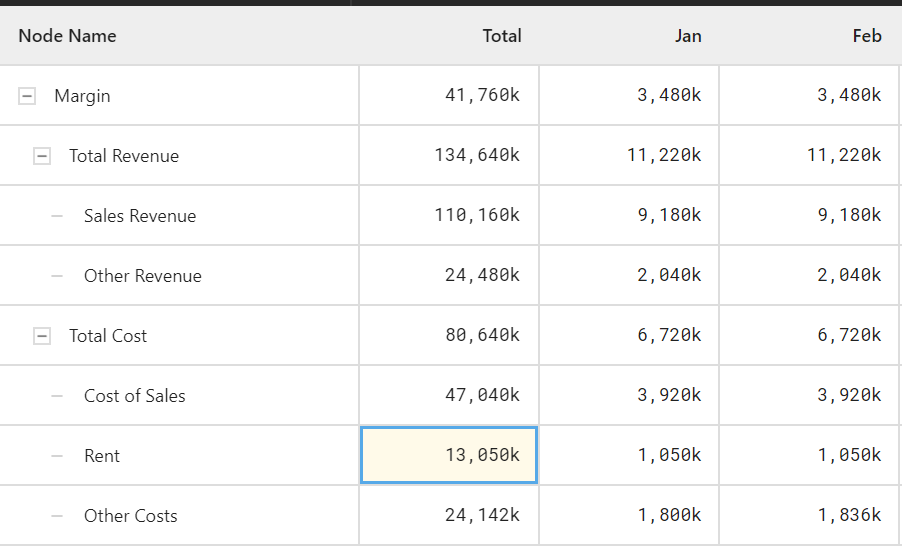
Cell Selection
Now click on the ‘Note’ Icon as shown below.

Note Icon
Enter the details in the note pop up as shown below.
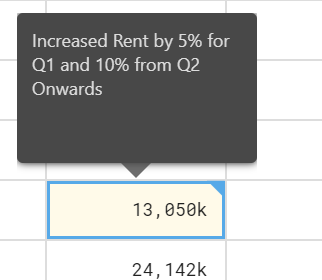
Comments for the cell
Once a note is entered, the cell would look similar to the Figure as shown below. On the right top corner, you can view a Note Indicator.
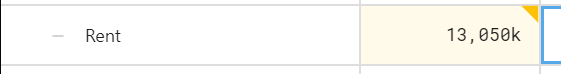
Note Indicator